A Gantt chart is a type of bar chart that illustrates a project schedule, helping to plan, coordinate, and track specific tasks and activities. The chart is named after its inventor, Henry Gantt, who first developed this visualization tool in the early 20th century. Gantt charts have become a fundamental tool in project management, enabling teams to visualize and manage complex projects with multiple tasks, dependencies, and timelines. Here are the key aspects of a Gantt chart:
1. Introduction to Gantt Charts
Gantt charts provide a graphical representation of a project schedule, allowing team members to see the start and end dates of each task, as well as the relationships between them. This visualization helps teams to identify potential bottlenecks, optimize resource allocation, and make informed decisions about project timelines and budgets.
2. Key Components of a Gantt Chart
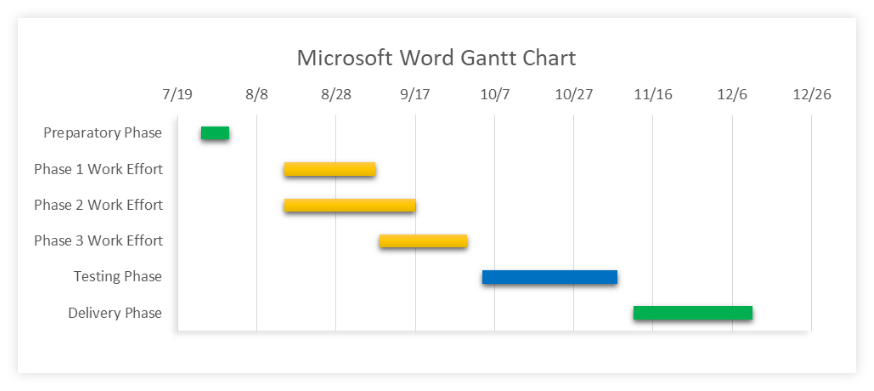
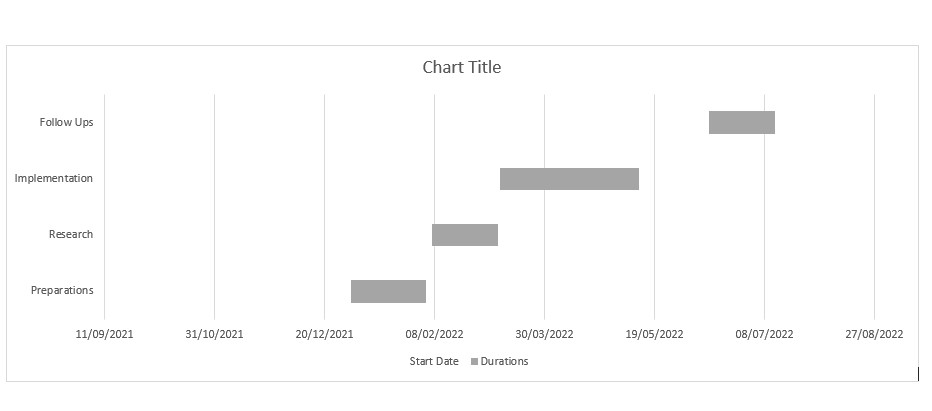
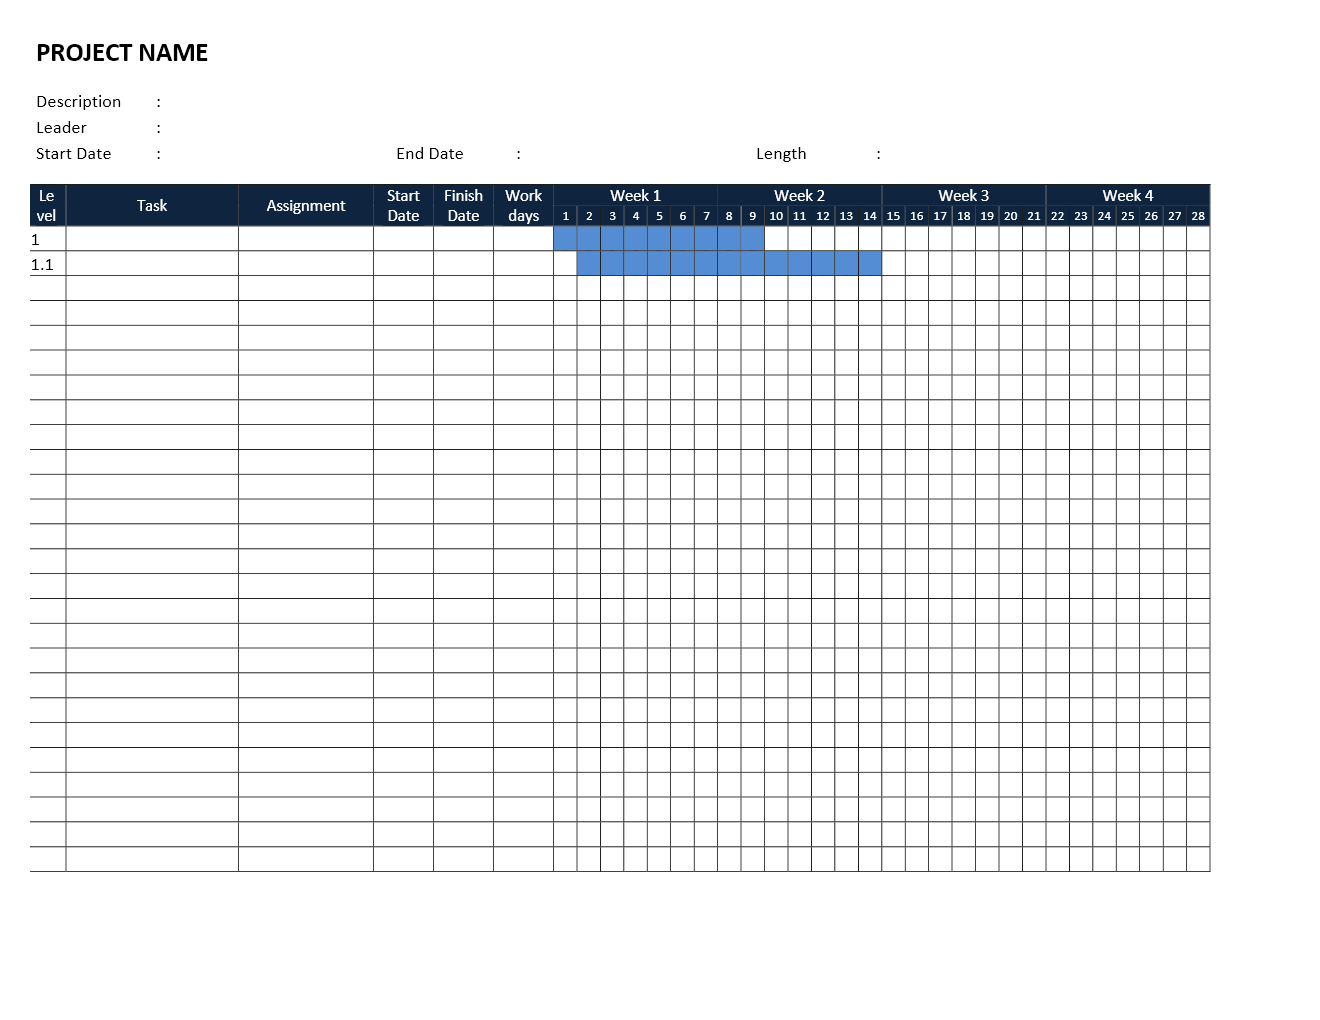
A standard Gantt chart consists of a table and a graph. The table lists all the tasks and activities, while the graph displays the corresponding bars, which represent the start and end dates of each task. The length of each bar is proportional to the duration of the task, and the bars are arranged in a way that shows the dependencies between tasks.
3. Task Dependencies
Task dependencies are a crucial aspect of Gantt charts, as they illustrate the relationships between different tasks. There are four types of dependencies: finish-to-start, start-to-start, finish-to-finish, and start-to-finish. These dependencies help teams to identify the critical path of a project, which is the sequence of tasks that determines the minimum duration required to complete the project.
4. Critical Path Method
The critical path method is a step-by-step approach to identifying the critical path of a project. It involves calculating the earliest start and finish dates for each task, as well as the latest start and finish dates. By analyzing these dates, teams can identify the tasks that are critical to the project timeline and allocate resources accordingly.
5. Gantt Chart Types
There are several types of Gantt charts, including classic Gantt charts, resource allocation Gantt charts, and project timeline Gantt charts. Each type of chart is designed to serve a specific purpose, such as planning, tracking, or reporting. For example, a resource allocation Gantt chart helps teams to visualize the allocation of resources, such as personnel, equipment, or materials, to different tasks.
6. Benefits of Gantt Charts
Gantt charts offer numerous benefits to teams, including improved project planning, enhanced collaboration, and better time management. By visualizing the project schedule, teams can identify potential problems early on and take corrective action. Gantt charts also facilitate communication among team members, stakeholders, and customers, ensuring that everyone is on the same page.
7. Limitations of Gantt Charts
While Gantt charts are a powerful tool for project management, they have some limitations. For example, they can become complex and difficult to read when dealing with large projects or multiple dependencies. Additionally, Gantt charts may not be suitable for projects with uncertain or dynamic timelines, such as agile projects.
8. Gantt Chart Software
There are many software tools available that support the creation and management of Gantt charts, including Microsoft Project, Asana, and Trello. These tools offer a range of features, such as automated scheduling, resource allocation, and collaboration tools, making it easier for teams to create and manage Gantt charts.
9. Best Practices for Creating Gantt Charts
To create effective Gantt charts, teams should follow best practices, such as defining clear project objectives, identifying all tasks and dependencies, and establishing realistic timelines. Teams should also regularly review and update the Gantt chart to reflect changes in the project scope, schedule, or resources.
10. Conclusion
In conclusion, Gantt charts are a valuable tool for project management, offering a visual representation of the project schedule and helping teams to plan, coordinate, and track tasks and activities. By understanding the key components, dependencies, and limitations of Gantt charts, teams can create effective charts that support successful project outcomes.
If you are looking for How to Make a Gantt Chart in Word you've visit to the right page. We have 10 Images about How to Make a Gantt Chart in Word like How to Make a Gantt Chart in Word, How to Make a Gantt Chart in Word and also Word Gantt Chart Download Reflexology Foot Chart | PDF wikiDownload. Here you go:
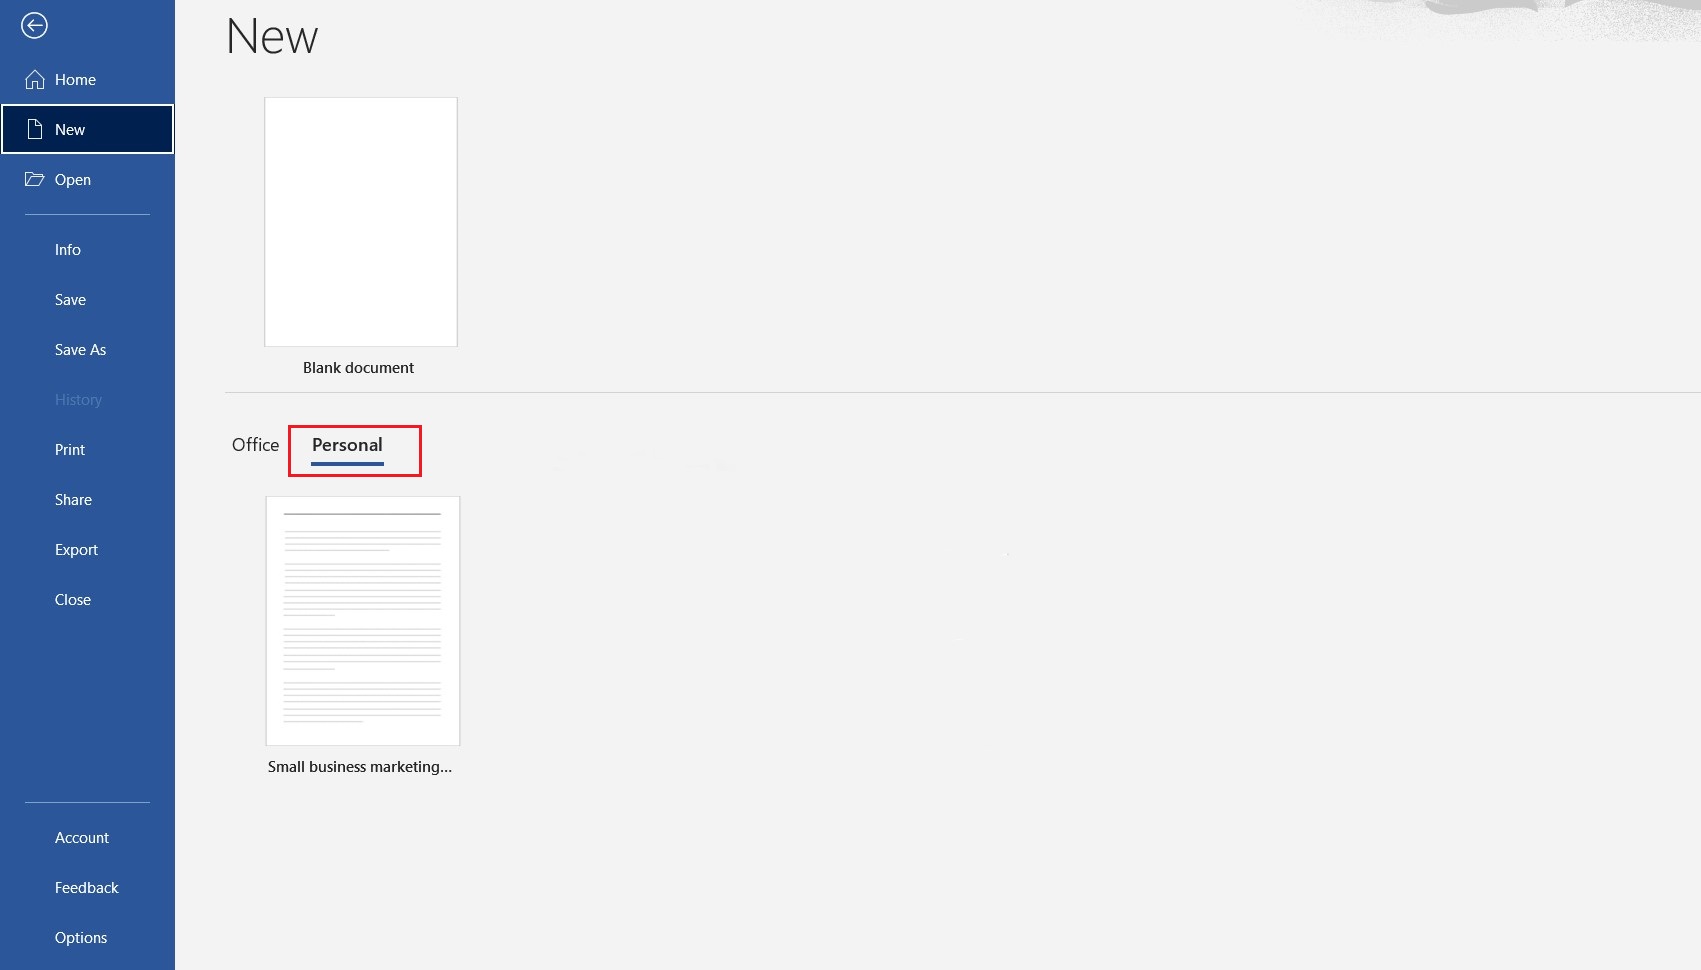
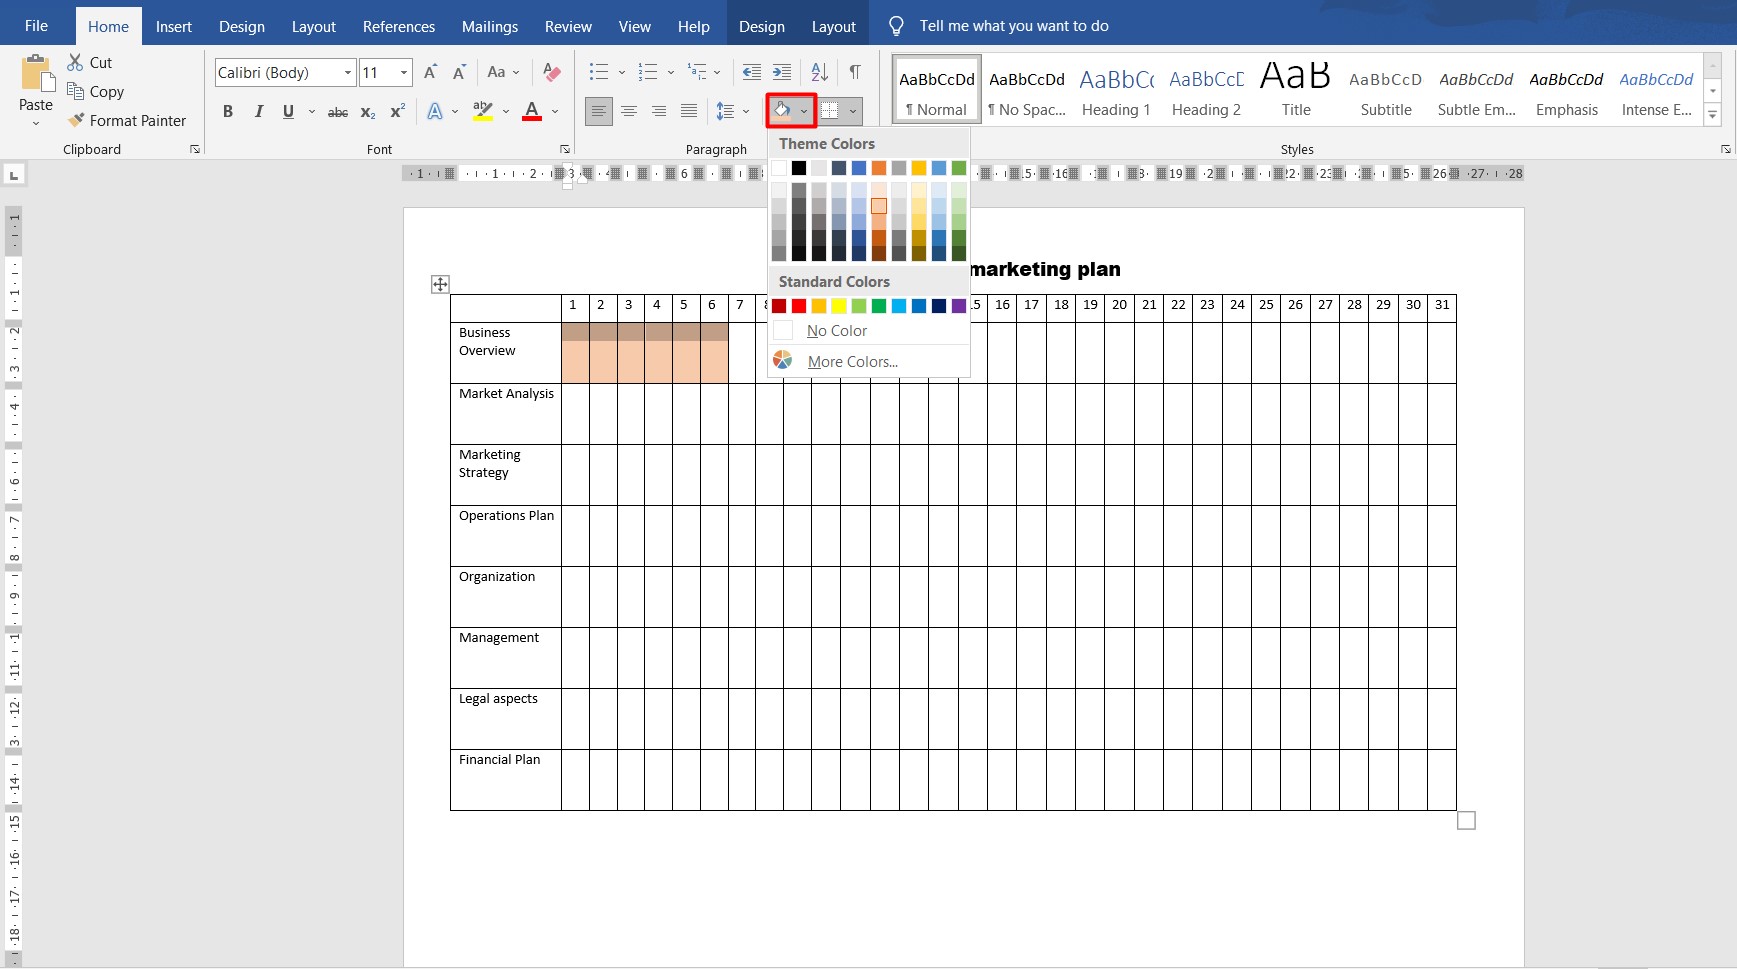
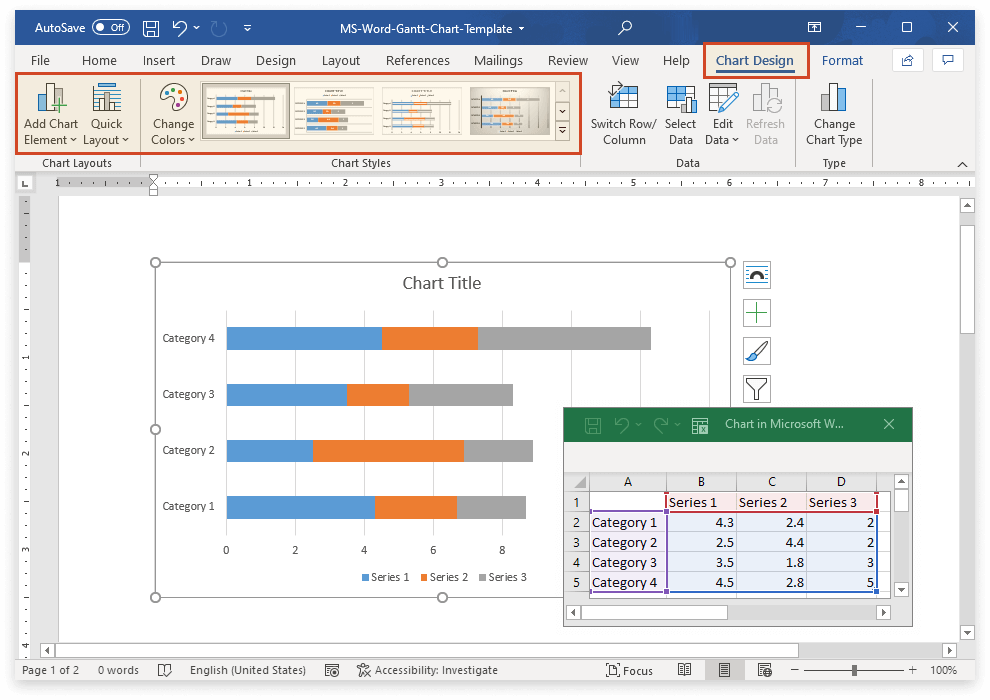
How To Make A Gantt Chart In Word
 blog.ganttpro.com
How to Make a Gantt Chart in Word
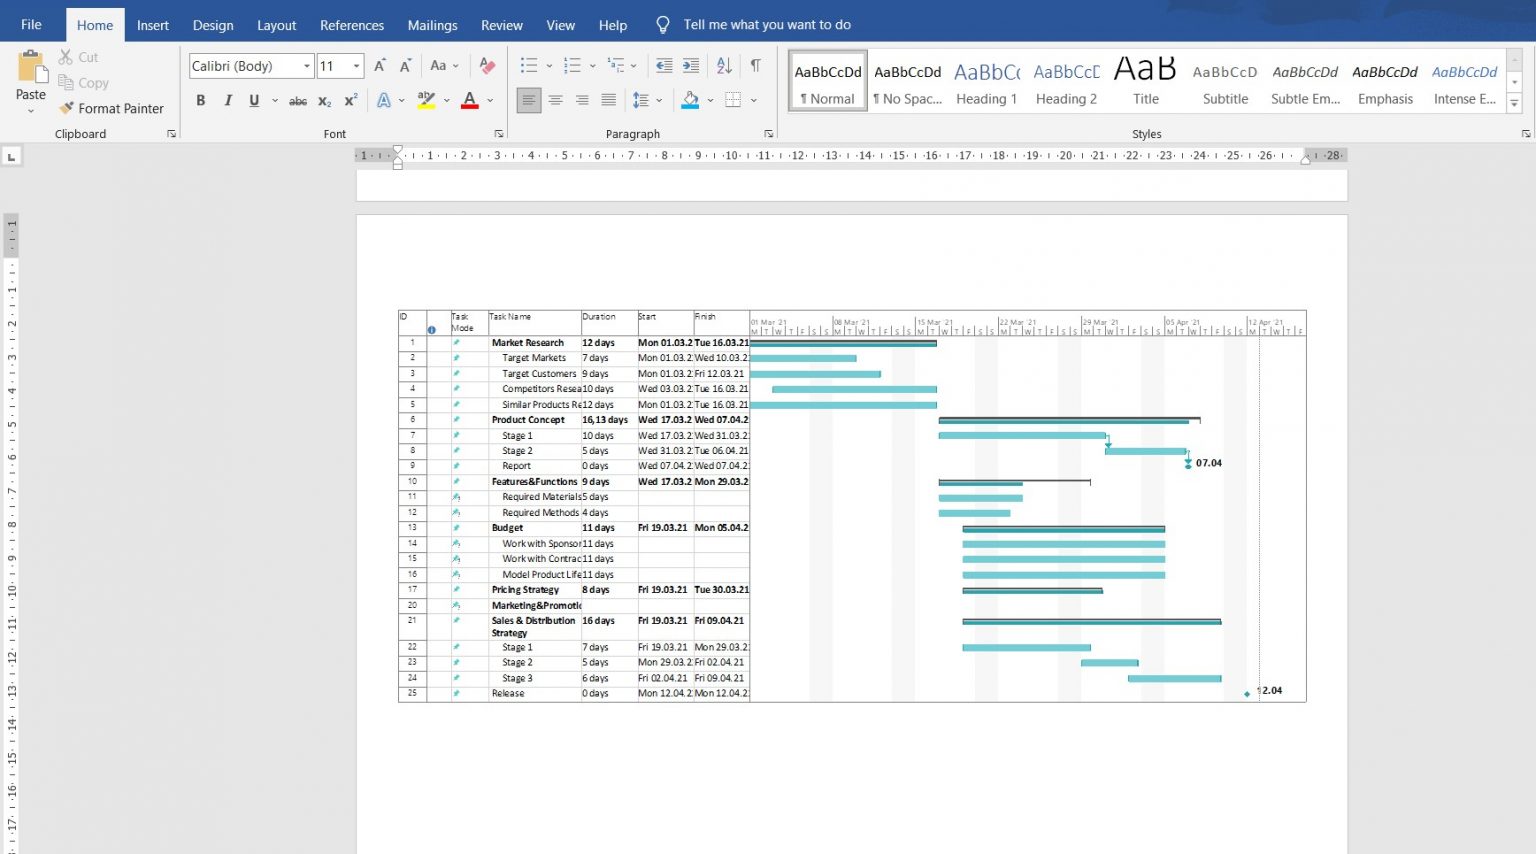
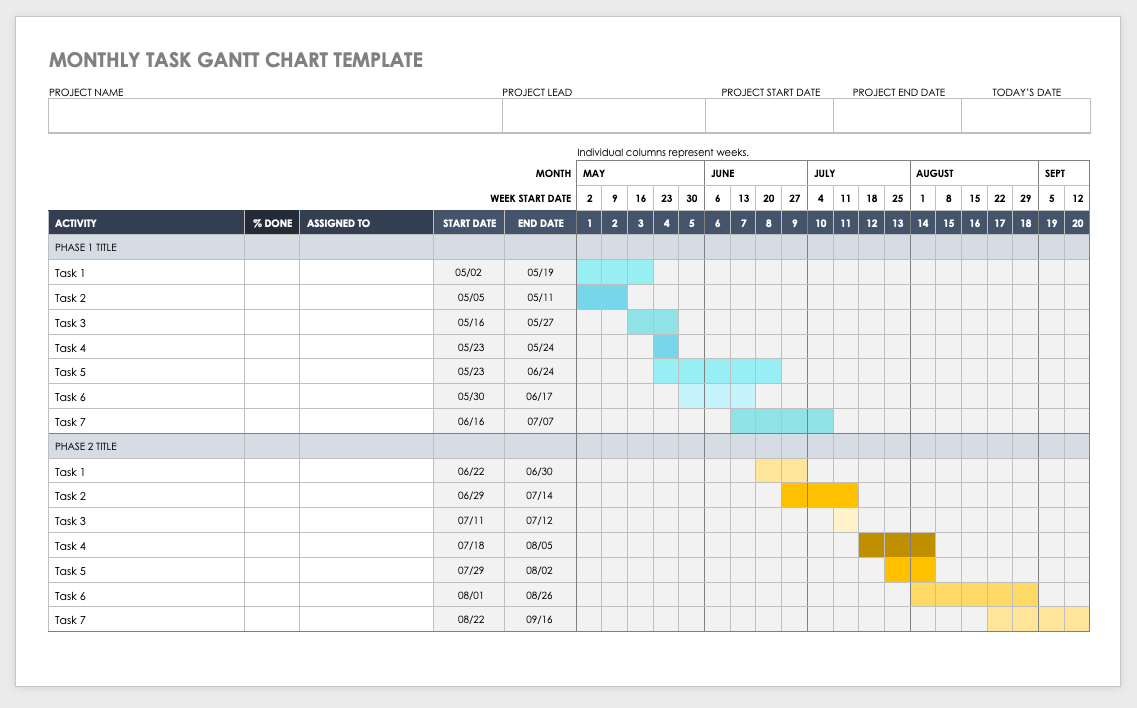
Word Gantt Chart Step By Step Guide To Creating Gorgeous Gantt Charts
 fity.club
Word Gantt Chart Step By Step Guide To Creating Gorgeous Gantt Charts
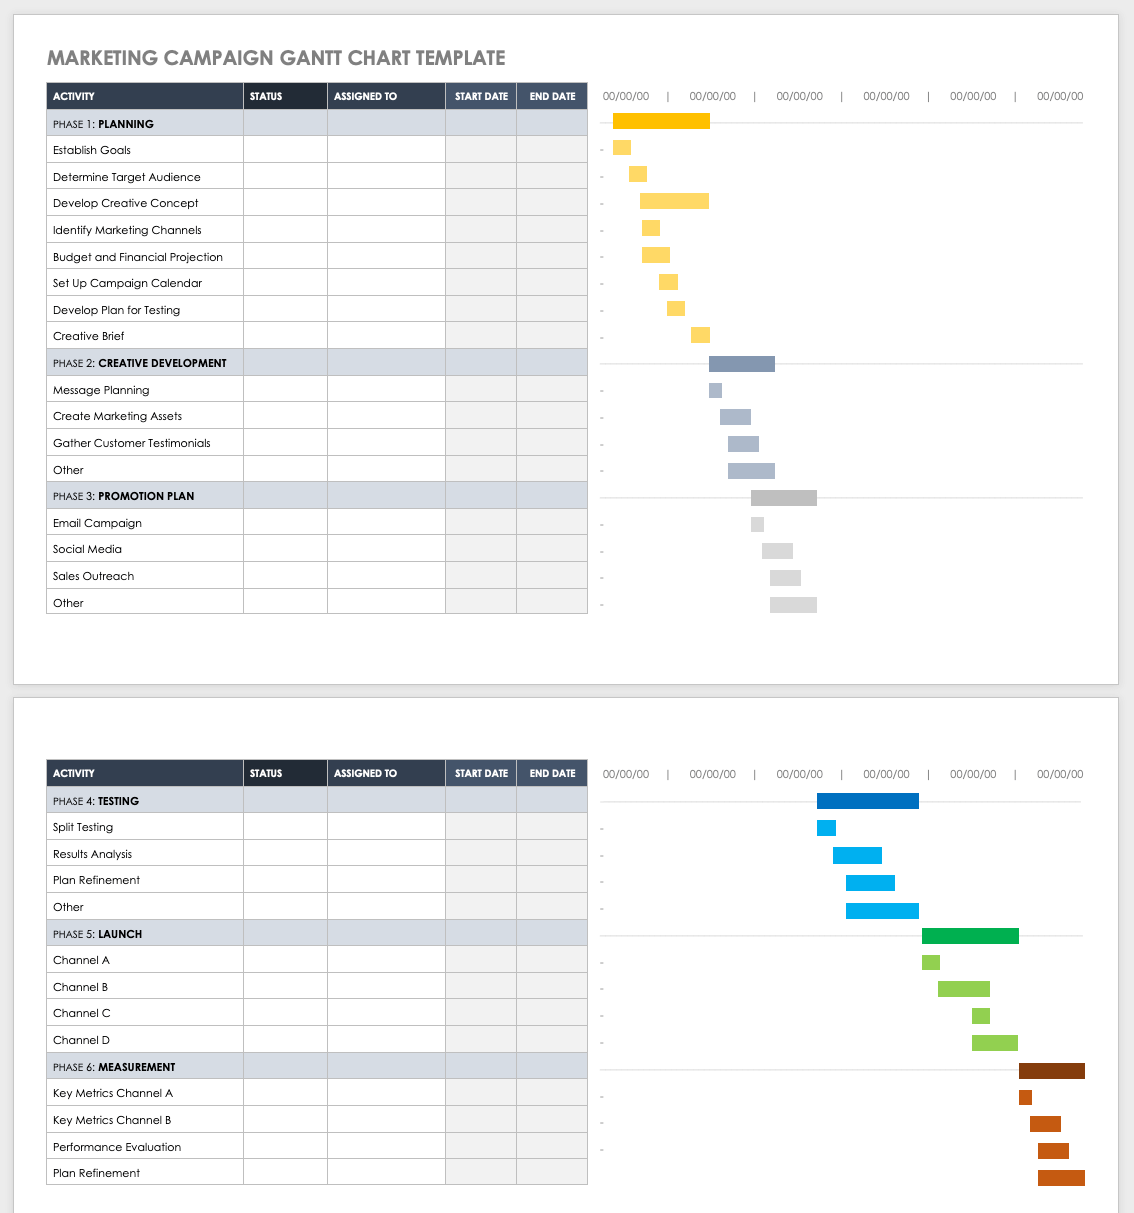
How To Make A Gantt Chart In Word
 blog.ganttpro.com
How to Make a Gantt Chart in Word
Word Gantt Chart Step By Step Guide To Creating Gorgeous Gantt Charts
 fity.club
Word Gantt Chart Step By Step Guide To Creating Gorgeous Gantt Charts
Word Gantt Chart Download Reflexology Foot Chart | PDF WikiDownload
 fity.club
Word Gantt Chart Download Reflexology Foot Chart | PDF wikiDownload
Word Gantt Chart Step By Step Guide To Creating Gorgeous Gantt Charts
 fity.club
Word Gantt Chart Step By Step Guide To Creating Gorgeous Gantt Charts
Word Gantt Chart Download Reflexology Foot Chart | PDF WikiDownload
 fity.club
Word Gantt Chart Download Reflexology Foot Chart | PDF wikiDownload
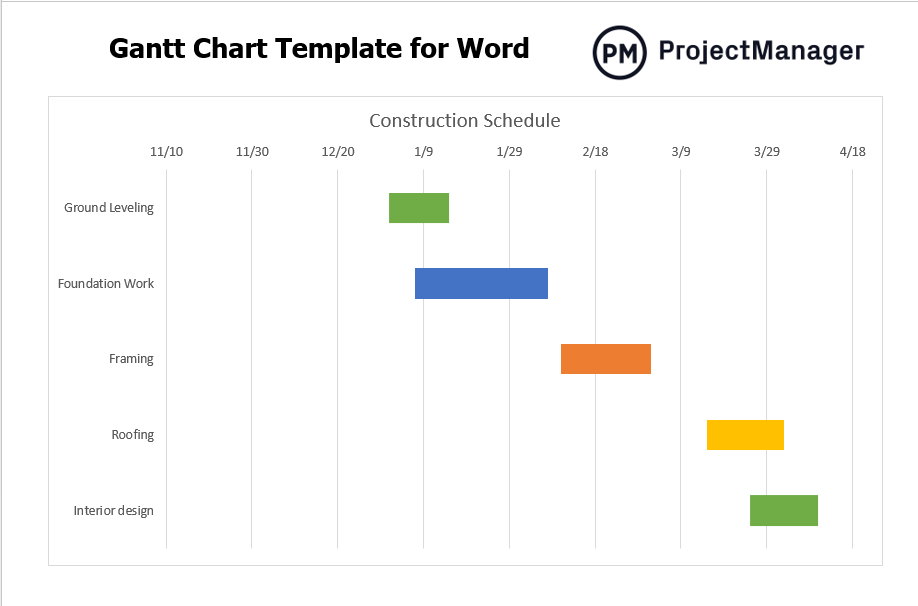
Word Gantt Chart
 fity.club
Word Gantt Chart
Word Gantt Chart Step By Step Guide To Creating Gorgeous Gantt Charts
 fity.club
Word Gantt Chart Step By Step Guide To Creating Gorgeous Gantt Charts
Gantt Chart Template Word Archives | Freewordtemplates.net
 freewordtemplates.net
gantt chart template word Archives | Freewordtemplates.net
Word gantt chart download reflexology foot chart. Word gantt chart. How to make a gantt chart in word

