To create a PERT chart, you'll need to follow a series of steps that help you visualize and manage your project's tasks and timelines. A PERT chart, also known as a Program Evaluation and Review Technique chart, is a valuable tool for project managers who want to analyze and represent the tasks involved in completing a project. The chart is a graphical representation of a project's timeline, including the tasks, dependencies, and time required to complete each task. Here's a step-by-step guide on how to make a PERT chart:
1. Define the Project and Its Objectives
The first step in creating a PERT chart is to define the project and its objectives. Identify the project's scope, goals, and deliverables. This will help you determine the tasks and activities required to complete the project. Break down the project into smaller, manageable tasks, and identify the dependencies between them. You can use a work breakdown structure (WBS) to decompose the project into smaller tasks and activities.
2. Identify the Tasks and Activities
Once you have defined the project and its objectives, identify the tasks and activities required to complete the project. Use the WBS to identify the tasks and activities, and make sure they are specific, measurable, achievable, relevant, and time-bound (SMART). Assign a unique identifier to each task, and describe the task in a brief statement. You can use a task list or a spreadsheet to record the tasks and activities.
3. Determine the Task Dependencies
Determine the dependencies between the tasks and activities. Identify which tasks are dependent on the completion of other tasks, and which tasks can be completed independently. Use a dependency diagram to visualize the relationships between the tasks. You can use a dependency diagram to identify the critical path, which is the sequence of tasks that determines the minimum duration required to complete the project.
4. Estimate the Task Durations
Estimate the duration required to complete each task. Use a three-point estimate, which includes the optimistic, pessimistic, and most likely duration. Calculate the expected duration using the formula: (optimistic + 4 * most likely + pessimistic) / 6. Record the estimated duration for each task, and use it to calculate the total project duration.
5. Draw the PERT Chart
Draw the PERT chart using a network diagram or a flowchart. Use rectangles or boxes to represent the tasks, and arrows to represent the dependencies between them. Draw the tasks in a sequence that reflects the dependencies between them. Use a time scale to represent the duration of each task, and draw the tasks to scale. You can use a software tool or a manual drawing tool to create the PERT chart.
6. Add the Task Information
Add the task information to the PERT chart, including the task identifier, description, and duration. Use a table or a list to record the task information, and annotate the chart with the task details. Make sure the chart is easy to read and understand, and use a key or a legend to explain the symbols and notations used on the chart.
7. Identify the Critical Path
Identify the critical path, which is the sequence of tasks that determines the minimum duration required to complete the project. Use the PERT chart to visualize the critical path, and highlight the tasks that are on the critical path. Calculate the slack or float for each task, which is the amount of time that a task can be delayed without affecting the project duration.
8. Review and Update the PERT Chart
Review and update the PERT chart regularly to reflect changes in the project scope, schedule, or resources. Use the chart to track the project progress, and identify any deviations from the planned schedule. Update the chart to reflect the actual task durations, and adjust the dependencies and task sequences as necessary. Use the chart to communicate the project status to stakeholders, and to identify areas for improvement.
9. Use the PERT Chart to Manage Risk
Use the PERT chart to manage risk by identifying potential risks and threats to the project. Analyze the chart to identify tasks that are on the critical path, and prioritize risk mitigation efforts accordingly. Develop a risk management plan, and use the chart to track the risk mitigation activities. Use the chart to identify opportunities for risk reduction, and to optimize the project schedule and resources.
10. Continuously Monitor and Control the Project
Continuously monitor and control the project using the PERT chart. Use the chart to track the project progress, and identify any deviations from the planned schedule. Take corrective action to get the project back on track, and use the chart to communicate the project status to stakeholders. Use the chart to evaluate the project performance, and to identify areas for improvement. Continuously update the chart to reflect changes in the project scope, schedule, or resources, and use it to ensure that the project is completed on time, within budget, and to the required quality standards.
If you are searching about How To Create A Good Pert Chart you've visit to the right place. We have 10 Images about How To Create A Good Pert Chart like How to create a PERT Chart step by step | PDF, Free PERT Chart Templates to Edit Online and also How to use a PERT chart for project planning | MiroBlog. Here you go:
How To Create A Good Pert Chart
 planyway.com
How To Create A Good Pert Chart
Pert Chart Template 30 Free Sample - RedlineSP
 www.redlinesp.net
Pert Chart Template 30 Free Sample - RedlineSP
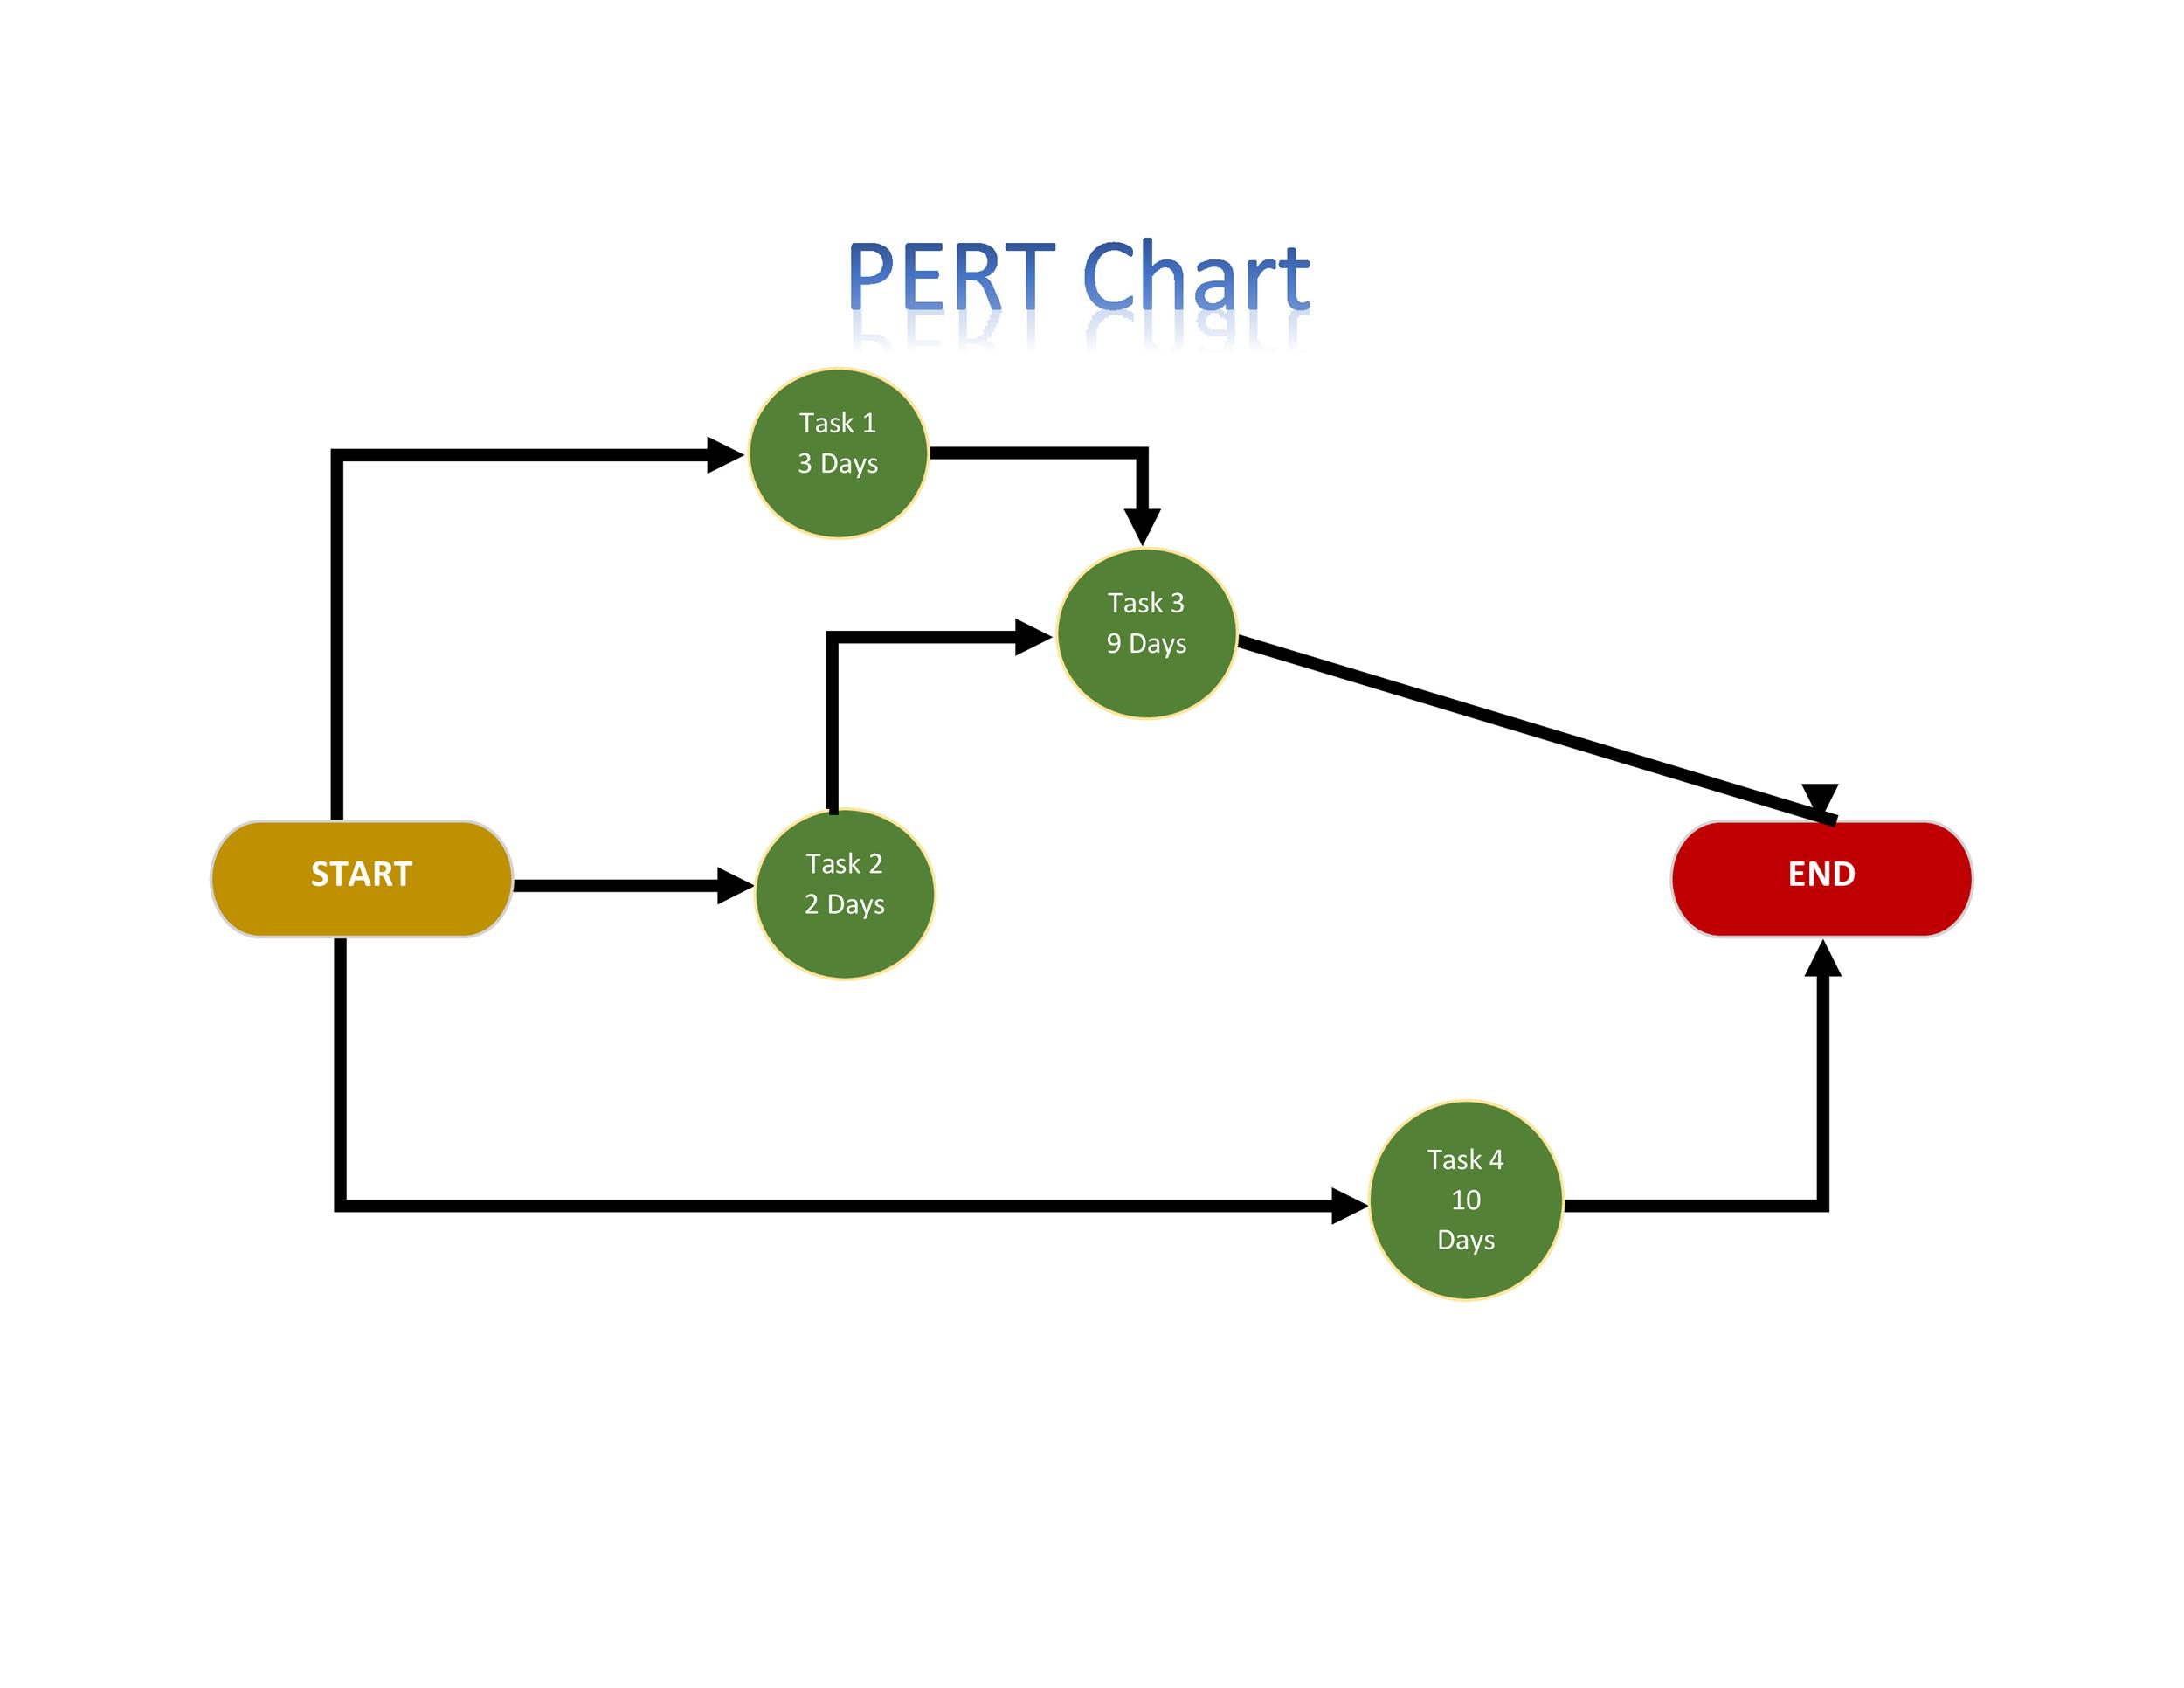
How To Create A PERT Chart Step By Step | PDF
 www.scribd.com
How to create a PERT Chart step by step | PDF
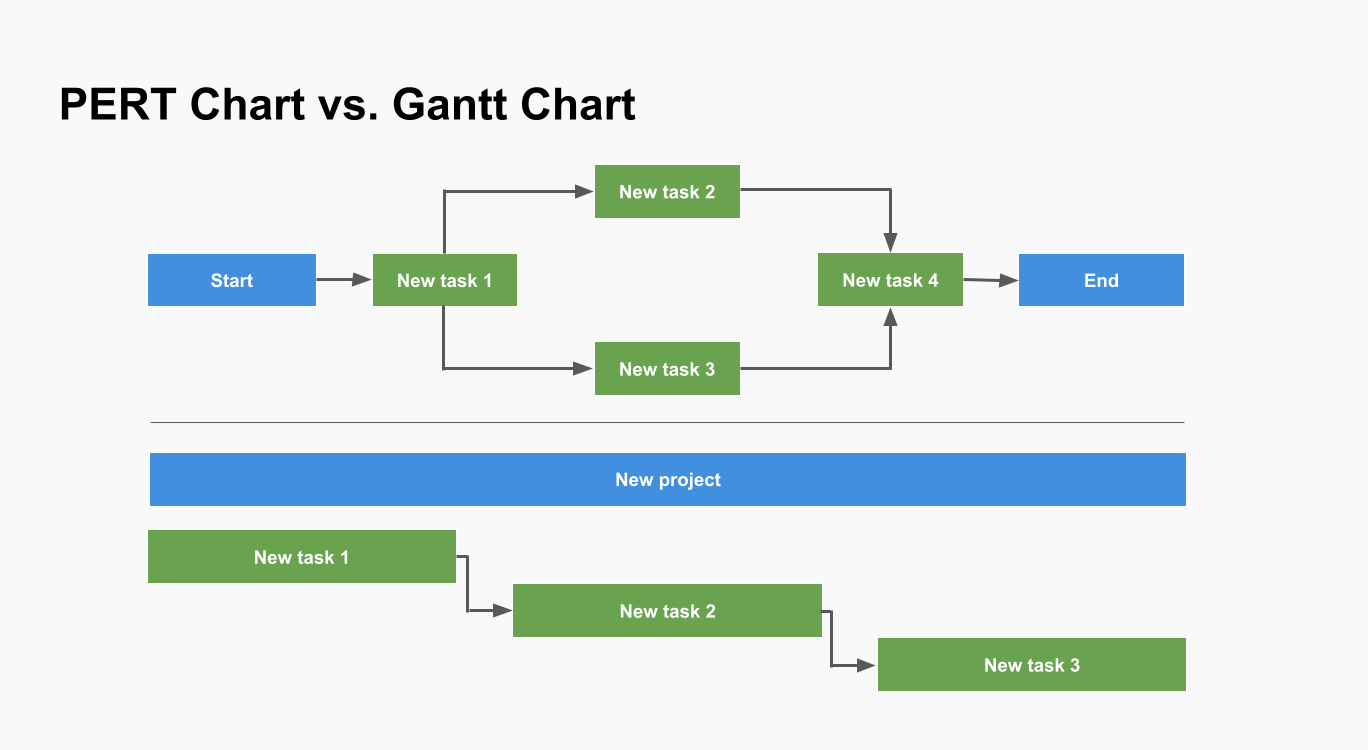
Gantt Pert Chart
 utpaqp.edu.pe
Gantt Pert Chart
How To Use A PERT Chart For Project Planning | MiroBlog
 miro.com
How to use a PERT chart for project planning | MiroBlog
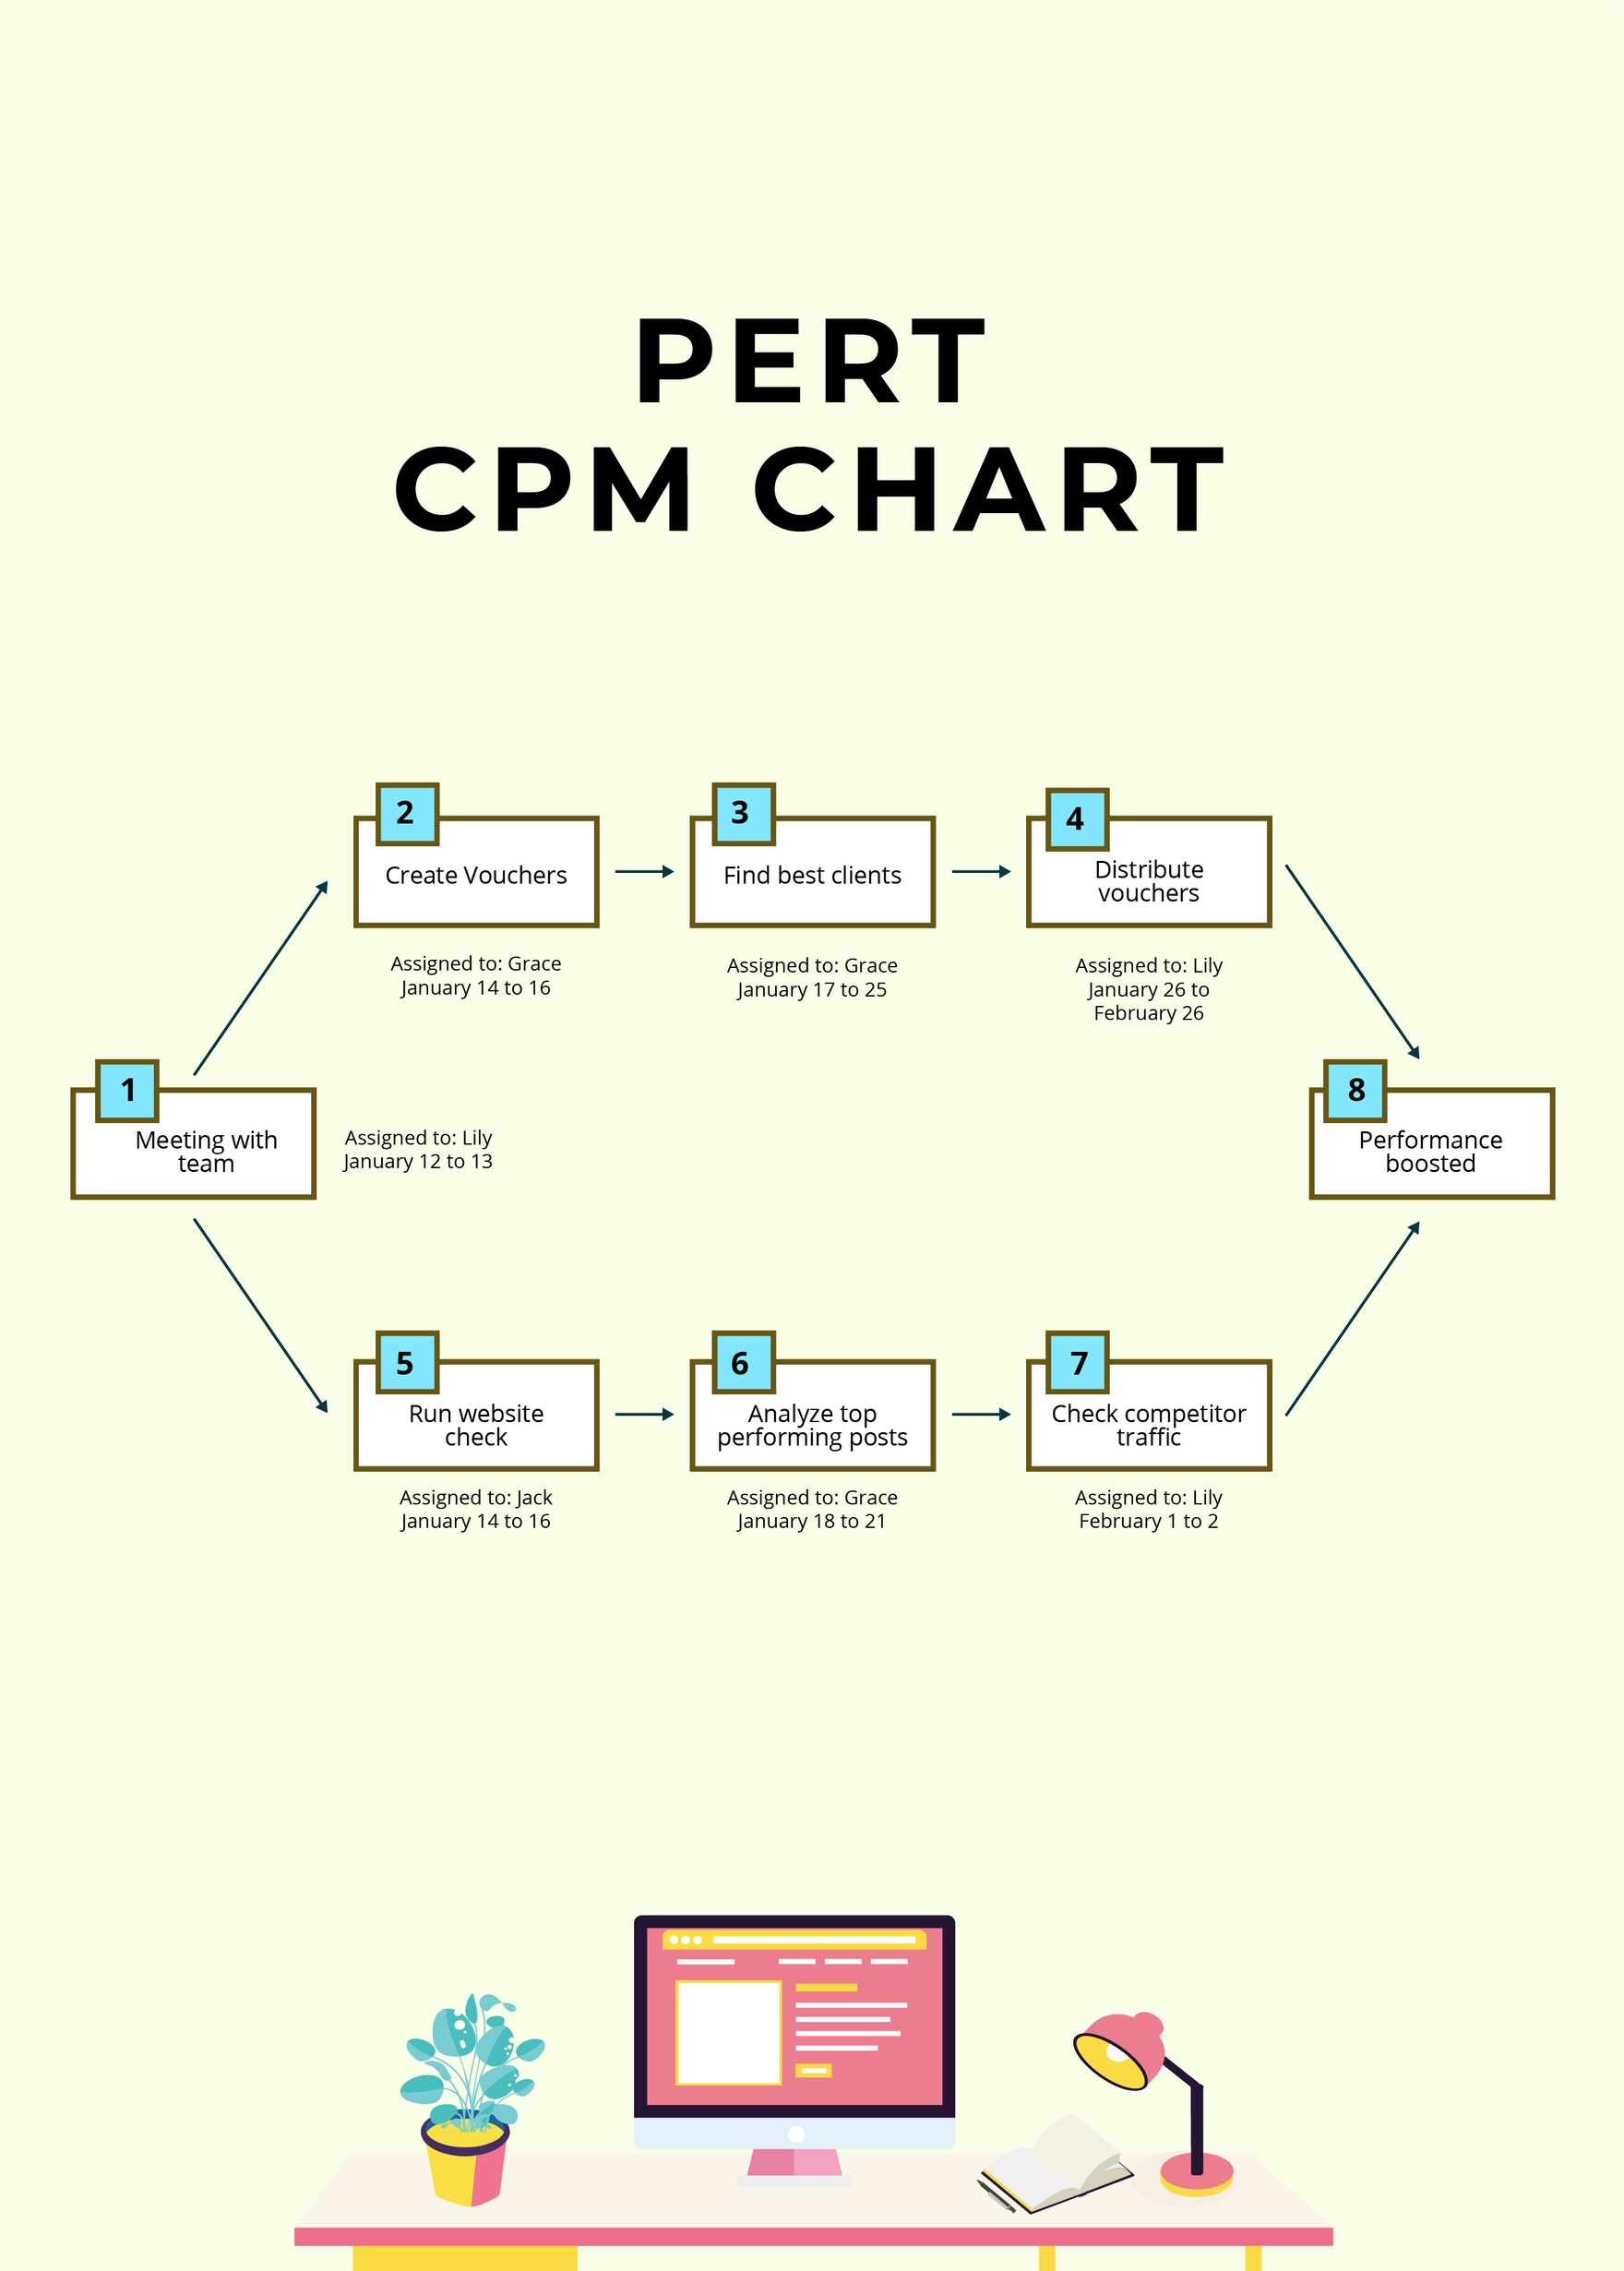
Free PERT Chart Templates To Edit Online
 www.template.net
Free PERT Chart Templates to Edit Online
Free PERT Chart Templates To Edit Online
 www.template.net
Free PERT Chart Templates to Edit Online
Pert Chart Template
 www.janetemplate.com
Pert Chart Template
What Is A Pert Chart And How Make One? [Examples & Templates] - Venngage
![What is a Pert Chart and How Make One? [Examples & Templates] - Venngage](https://venngage-wordpress.s3.amazonaws.com/uploads/2023/11/image-13.png) venngage.com
venngage.com
What is a Pert Chart and How Make One? [Examples & Templates] - Venngage
Pert Chart For Construction Projectpert Chart Sample
 utpaqp.edu.pe
Pert Chart For Construction Projectpert Chart Sample
Free pert chart templates to edit online. Free pert chart templates to edit online. Free pert chart templates to edit online

