When working with data in Excel, understanding the spread or dispersion of your data set is crucial for making informed decisions. One of the key metrics used to measure this dispersion is the standard deviation. In this article, we'll delve into the world of Excel standard deviation calculation, exploring how to calculate it, its significance, and some useful tips and tricks to get the most out of your data analysis.
1. What is Standard Deviation in Excel?
Standard deviation in Excel is a measure of the amount of variation or dispersion of a set of values. A low standard deviation indicates that the values tend to be close to the mean, while a high standard deviation indicates that the values are spread out over a wider range. Excel provides several functions to calculate the standard deviation, including STDEV.S, STDEV.P, STDEVA, and STDEVPA.
2. Understanding the Different Types of Standard Deviation in Excel
There are two main types of standard deviation in Excel: sample standard deviation and population standard deviation. The sample standard deviation is used when you're working with a subset of data, while the population standard deviation is used when you have the entire data set. Excel functions like STDEV.S and STDEV.P are used to calculate these respectively.
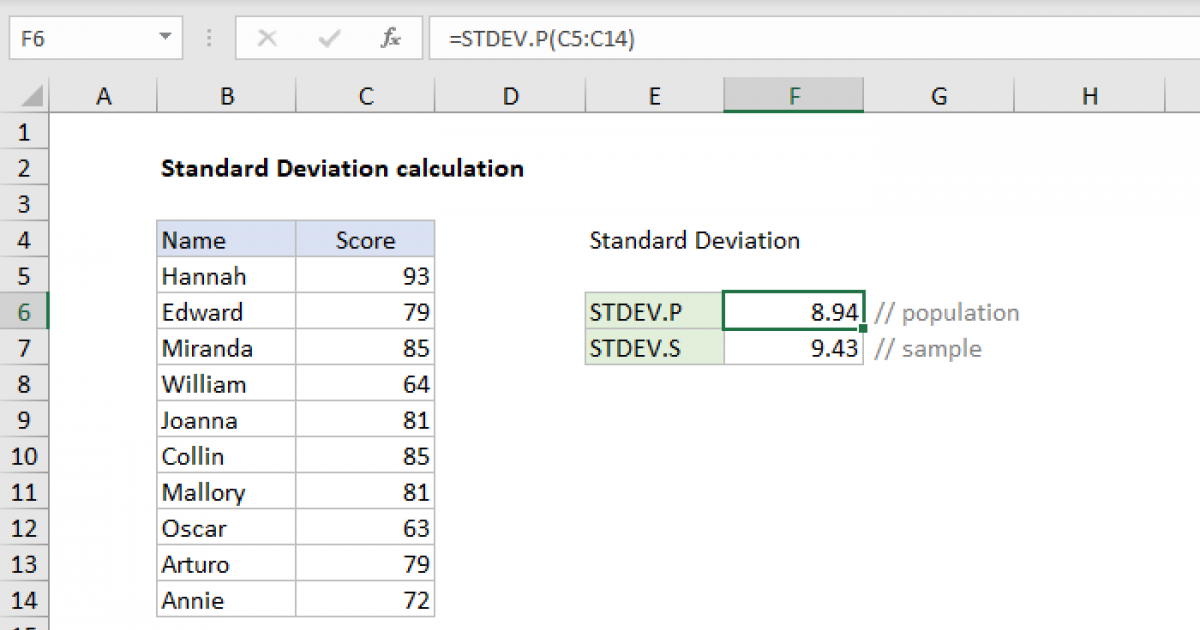
3. Calculating Standard Deviation using STDEV.S
The STDEV.S function in Excel calculates the sample standard deviation. The syntax for this function is STDEV.S(number1, [number2], ...), where number1, number2, etc., are the values for which you want to calculate the standard deviation. For example, if you have a range of values in cells A1:A10, you can use the formula =STDEV.S(A1:A10) to calculate the sample standard deviation.
4. Calculating Standard Deviation using STDEV.P
The STDEV.P function in Excel calculates the population standard deviation. The syntax for this function is similar to STDEV.S, where STDEV.P(number1, [number2], ...) calculates the standard deviation for the entire population. Using the same example as before, if you have the entire data set in cells A1:A10, you can use the formula =STDEV.P(A1:A10) to calculate the population standard deviation.
5. Understanding the Importance of Standard Deviation in Data Analysis
Standard deviation is a critical component of data analysis because it helps you understand the variability of your data. A small standard deviation means that the data points are closely packed around the mean, while a large standard deviation indicates that the data points are more spread out. This information can be used to make predictions, identify outliers, and compare data sets.
6. How to Interpret Standard Deviation Results
Interpreting standard deviation results requires understanding what the value represents. A standard deviation close to zero means that the data points are very consistent, while a high standard deviation indicates more variability. For example, if you're analyzing exam scores with a mean of 85 and a standard deviation of 5, you can expect most scores to fall between 80 and 90.
7. Using Standard Deviation to Identify Outliers
One of the practical applications of standard deviation is identifying outliers in your data set. Outliers are data points that are significantly different from the other observations. A common rule of thumb is that any data point more than 2 standard deviations away from the mean is considered an outlier. Excel's STDEV.S and STDEV.P functions can help you calculate these benchmarks.
8. Tips for Working with Standard Deviation in Excel
When working with standard deviation in Excel, it's essential to choose the right function based on whether you're dealing with a sample or the entire population. Additionally, ensure that your data set is free of errors and does not contain non-numeric values, as these can skew your results. Using absolute references and naming ranges can also make your formulas more readable and easier to maintain.
9. Common Mistakes to Avoid When Calculating Standard Deviation
One of the common mistakes when calculating standard deviation in Excel is using the wrong function for the type of data you have. Another mistake is including non-numeric data in your calculation range, which can lead to errors. It's also crucial to ensure that your data set is representative and not biased, as this can affect the accuracy of your standard deviation calculation.
10. Conclusion on Mastering Standard Deviation in Excel
Mastering the standard deviation calculation in Excel is a powerful tool for data analysis. By understanding the different types of standard deviation, how to calculate them, and how to interpret the results, you can unlock deeper insights into your data. Whether you're working with sample data or the entire population, Excel's built-in functions and a solid understanding of statistical principles can help you make more informed decisions and drive better outcomes.
If you are searching about Excel : Understanding standard deviation and choosing the right you've visit to the right web. We have 10 Images about Excel : Understanding standard deviation and choosing the right like Standard deviation calculation - Excel formula | Exceljet, Standard deviation calculation - Excel formula | Exceljet and also How to Perform a Standard Deviation IF Calculation in Excel. Here you go:
Excel : Understanding Standard Deviation And Choosing The Right
 www.excel-zone.com
Excel : Understanding standard deviation and choosing the right ...
Standard Deviation Calculation - Excel Formula | Exceljet
 exceljet.net
Standard deviation calculation - Excel formula | Exceljet
How To Perform A Standard Deviation IF Calculation In Excel
 www.statology.org
How to Perform a Standard Deviation IF Calculation in Excel
Standard Deviation Calculation - Excel Formula | Exceljet
 exceljet.net
Standard deviation calculation - Excel formula | Exceljet
How To Calculate Standard Deviation In Excel (with Examples) - Excel
 excelinsider.com
How to Calculate Standard Deviation in Excel (with Examples) - Excel ...
How To Calculate Standard Deviation In Excel - That Excel Site
 thatexcelsite.com
How to Calculate Standard Deviation in Excel - That Excel Site
How To Calculate Standard Deviation In Excel - That Excel Site
 thatexcelsite.com
How to Calculate Standard Deviation in Excel - That Excel Site
Calculation Of Standard Deviation Using Excel Spreadsheet
 www.academia.edu
Calculation of standard deviation using excel spreadsheet
How To Calculate Standard Deviation In Excel (with Examples) - Excel
 excelinsider.com
How to Calculate Standard Deviation in Excel (with Examples) - Excel ...
How To Calculate Standard Deviation In Excel - That Excel Site
 thatexcelsite.com
How to Calculate Standard Deviation in Excel - That Excel Site
How to calculate standard deviation in excel. How to calculate standard deviation in excel (with examples). How to calculate standard deviation in excel

