Calculating a z-test is a crucial step in hypothesis testing, allowing researchers to determine whether their findings are statistically significant. The z-test is a statistical test used to compare the mean of a sample to a known population mean, and it's commonly used in various fields, including medicine, social sciences, and business. In this article, we'll break down the steps to calculate a z-test, providing you with a clear understanding of the process.
1. Define the Null and Alternative Hypotheses
The first step in calculating a z-test is to define the null and alternative hypotheses. The null hypothesis (H0) states that there is no significant difference between the sample mean and the population mean, while the alternative hypothesis (H1) states that there is a significant difference. For example, if you're testing the effect of a new drug on blood pressure, the null hypothesis might state that the mean blood pressure of the sample is equal to the known population mean, while the alternative hypothesis might state that the mean blood pressure of the sample is lower than the known population mean.
2. Choose a Significance Level
The next step is to choose a significance level, also known as the alpha level, which is the probability of rejecting the null hypothesis when it's true. The most common significance level is 0.05, which means that there's a 5% chance of rejecting the null hypothesis when it's true. The significance level you choose will depend on the specific research question and the level of risk you're willing to accept.
3. Calculate the Sample Mean and Standard Deviation
To calculate the z-test, you'll need to calculate the sample mean and standard deviation. The sample mean is the average value of the sample, and it's calculated by summing up all the values and dividing by the sample size. The sample standard deviation is a measure of the spread of the sample, and it's calculated using the formula: s = sqrt(Σ(xi - x̄)² / (n - 1)), where xi is each individual data point, x̄ is the sample mean, and n is the sample size.
4. State the Known Population Mean and Standard Deviation
The z-test requires knowledge of the known population mean and standard deviation. The population mean is the average value of the population, and it's often denoted by the symbol μ. The population standard deviation is a measure of the spread of the population, and it's often denoted by the symbol σ. If you don't know the population standard deviation, you can use the sample standard deviation as an estimate, but this will affect the accuracy of the test.
5. Calculate the Standard Error
The standard error is a measure of the variability of the sample mean, and it's calculated using the formula: SE = σ / sqrt(n), where σ is the population standard deviation and n is the sample size. The standard error is used to calculate the z-score, which is the number of standard errors away from the population mean that the sample mean lies.
6. Calculate the Z-Score
The z-score is calculated using the formula: z = (x̄ - μ) / SE, where x̄ is the sample mean, μ is the population mean, and SE is the standard error. The z-score tells you how many standard errors away from the population mean the sample mean lies. A z-score of 0 means that the sample mean is equal to the population mean, while a positive z-score means that the sample mean is higher than the population mean, and a negative z-score means that the sample mean is lower than the population mean.
7. Determine the Critical Region
The critical region is the region of the z-distribution where the null hypothesis is rejected. The critical region depends on the significance level and the alternative hypothesis. If the alternative hypothesis is one-tailed (i.e., the sample mean is either higher or lower than the population mean), the critical region is either the upper or lower tail of the z-distribution. If the alternative hypothesis is two-tailed (i.e., the sample mean is either higher or lower than the population mean), the critical region is both the upper and lower tails of the z-distribution.
8. Compare the Z-Score to the Critical Value
Finally, compare the calculated z-score to the critical value. The critical value is the z-score that corresponds to the chosen significance level. If the calculated z-score is more extreme than the critical value, the null hypothesis is rejected, and you conclude that there's a statistically significant difference between the sample mean and the population mean. If the calculated z-score is less extreme than the critical value, the null hypothesis is not rejected, and you conclude that there's no statistically significant difference between the sample mean and the population mean.
9. Interpret the Results
Once you've compared the z-score to the critical value, interpret the results in the context of the research question. If you reject the null hypothesis, it means that there's a statistically significant difference between the sample mean and the population mean. If you fail to reject the null hypothesis, it means that there's no statistically significant difference between the sample mean and the population mean. Keep in mind that the z-test assumes that the sample is randomly selected from the population and that the population is normally distributed.
10. Consider the Limitations
Finally, consider the limitations of the z-test. The z-test assumes that the population is normally distributed, which may not always be the case. Additionally, the z-test is sensitive to outliers, which can affect the accuracy of the test. Therefore, it's essential to check the assumptions of the z-test and consider alternative tests, such as the t-test or non-parametric tests, if the assumptions are not met.
If you are looking for Statistics Worksheet Calculating Zscores you've came to the right place. We have 10 Pics about Statistics Worksheet Calculating Zscores like Statistics Worksheet Calculating Zscores, Z-Test: Formula, Examples, Uses, Z-Test vs T-Test and also Z-Test: Calculating Z Scores Guide | PDF. Here it is:
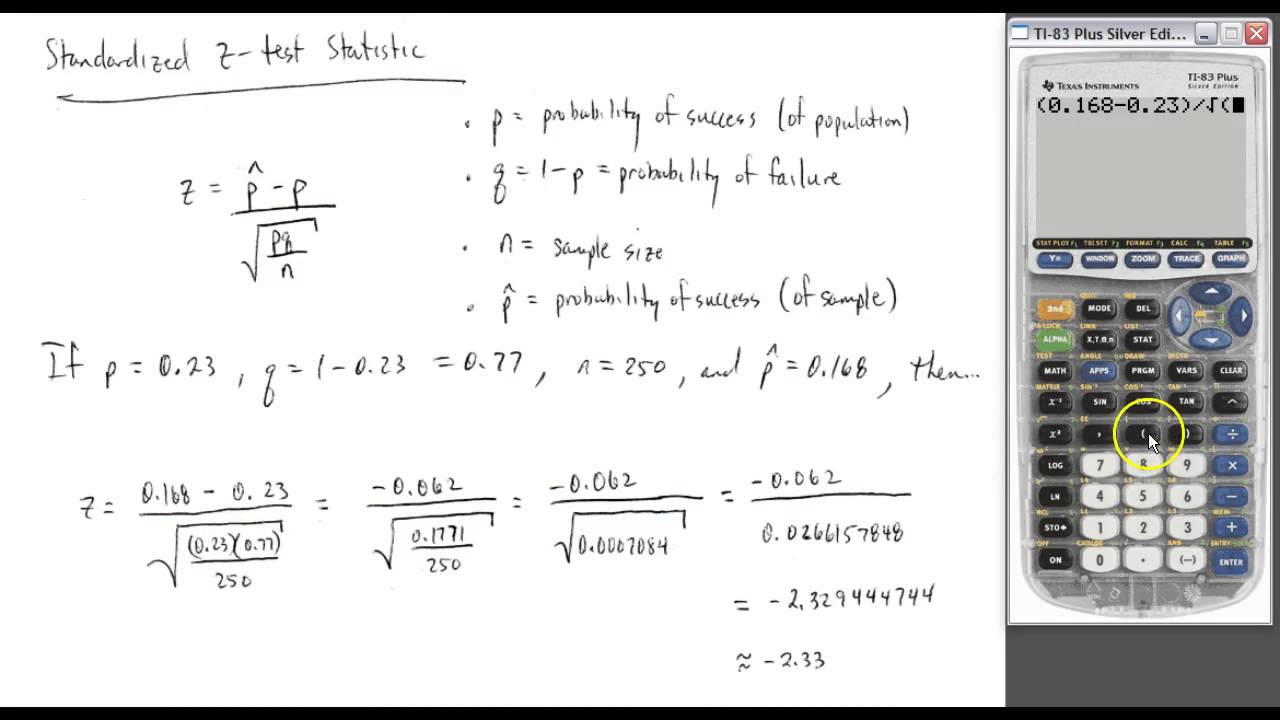
Statistics Worksheet Calculating Zscores
 fity.club
Statistics Worksheet Calculating Zscores
Z-Test: Calculating Z Scores Guide | PDF
 www.scribd.com
Z-Test: Calculating Z Scores Guide | PDF
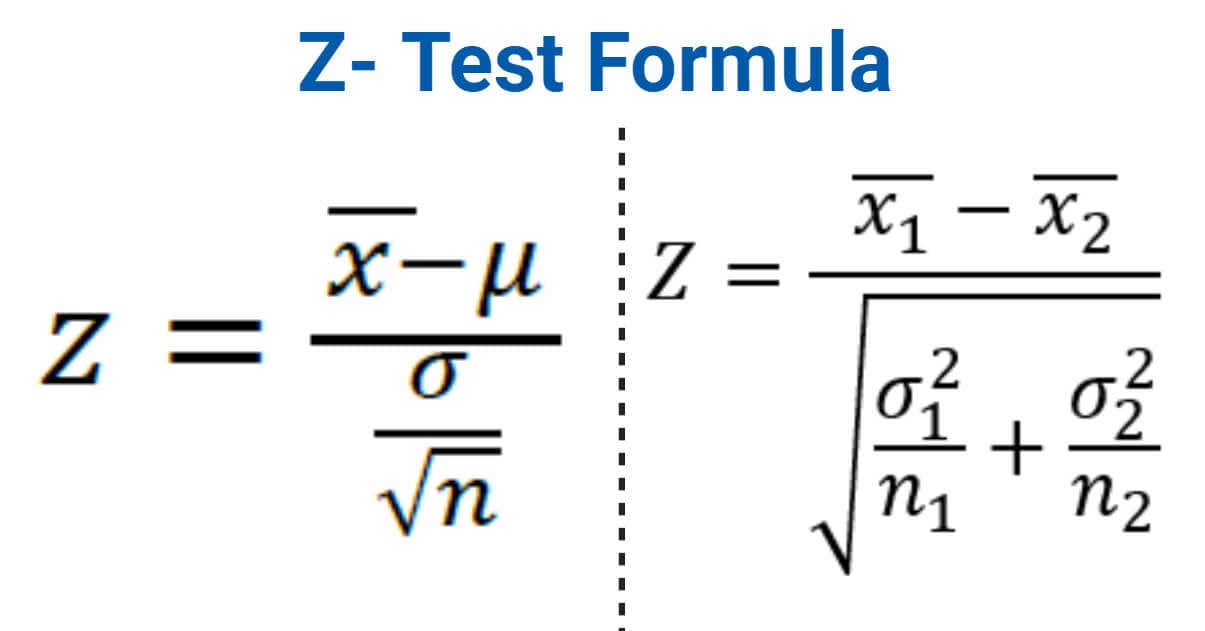
Z-Test: Formula, Examples, Uses, Z-Test Vs T-Test
 microbenotes.com
Z-Test: Formula, Examples, Uses, Z-Test vs T-Test
Z-Test Calculator: Calculate Z-Score Like A Pro!
 wishmetool.com
Z-Test Calculator: Calculate Z-Score Like A Pro!
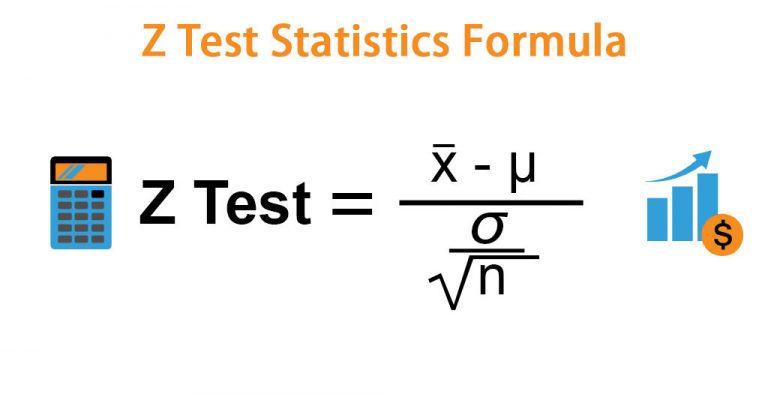
Z Test Statistics Formula | Calculator (Examples With Excel Template)
 www.educba.com
Z Test Statistics Formula | Calculator (Examples With Excel Template)
Z Test 1 43 EBBRO 43575 Nismo Z Test Car JGTC 2004 #023 Model Cars For
 fity.club
Z Test 1 43 EBBRO 43575 Nismo Z Test Car JGTC 2004 #023 Model Cars For
Z Test 1 43 EBBRO 43575 Nismo Z Test Car JGTC 2004 #023 Model Cars For
:max_bytes(150000):strip_icc()/z-test.asp-final-81378e9e20704163ba30aad511c16e5d.jpg) fity.club
fity.club
Z Test 1 43 EBBRO 43575 Nismo Z Test Car JGTC 2004 #023 Model Cars For
Z-test: Definition, Formula, Examples, Uses, Z-test Vs T-test
 microbenotes.com
Z-test: Definition, formula, examples, uses, z-test vs t-test
T Test Vs Z Test: Key Differences And One-Sample Formulas
 www.wikihow.com
T Test vs Z Test: Key Differences and One-Sample Formulas
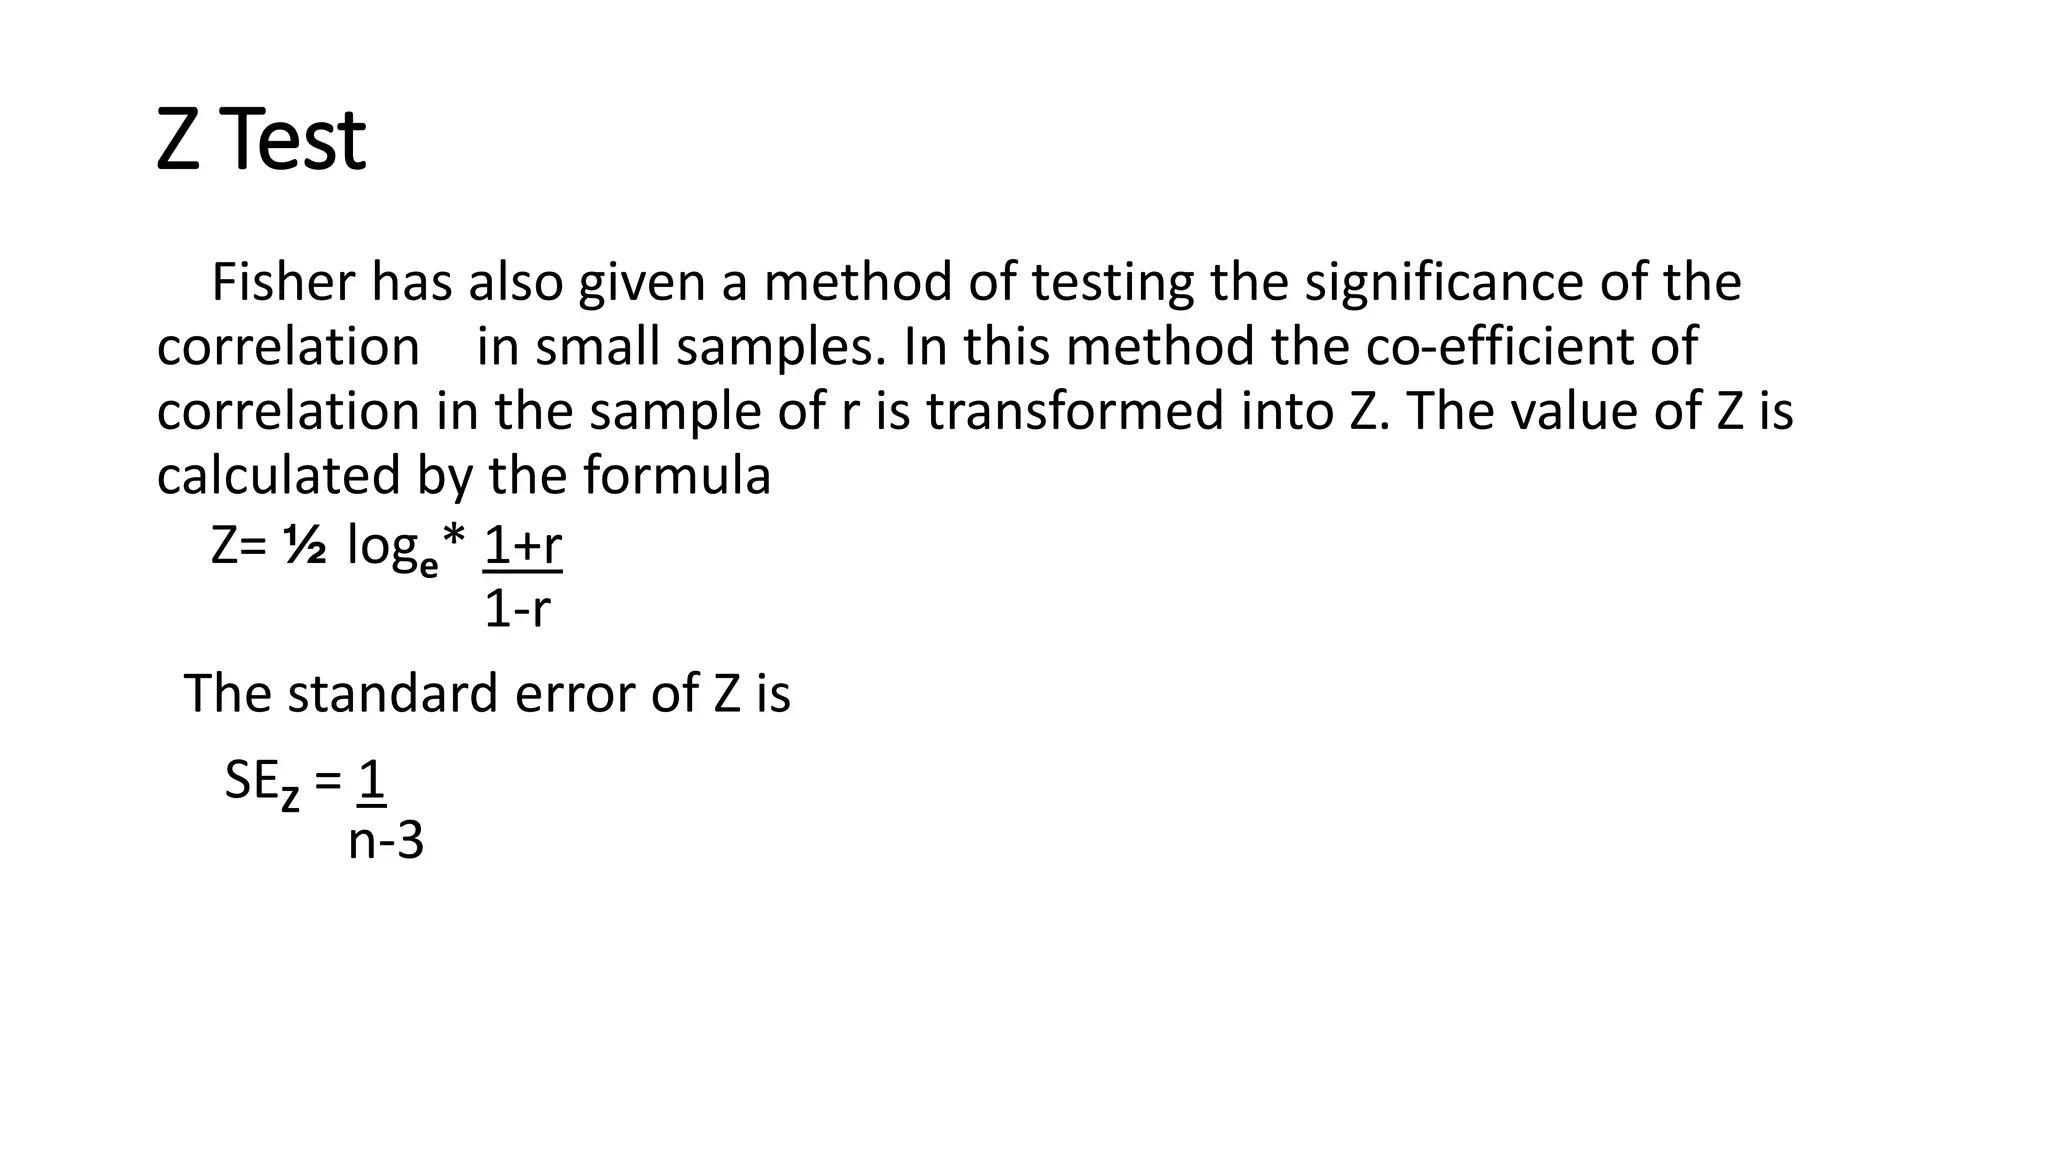
Z Test | PPT
 www.slideshare.net
Z test | PPT
Statistics worksheet calculating zscores. z-test: calculating z scores guide. T test vs z test: key differences and one-sample formulas

