Calculating the z-value, also known as a standard score, is a statistical method used to determine how many standard deviations an element is from the mean. It is a crucial concept in data analysis and hypothesis testing. The z-value can help researchers and data analysts understand the relative position of a data point within a distribution. In this article, we will explore the steps and considerations for calculating the z-value in various contexts.
1. Understanding the Formula
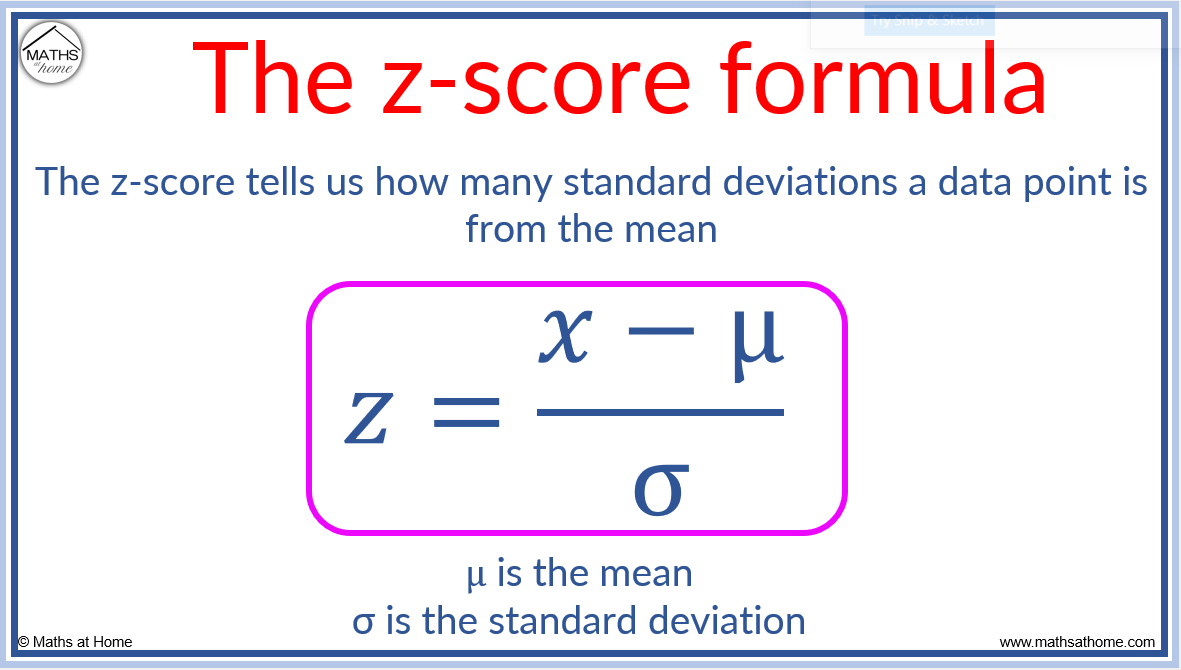
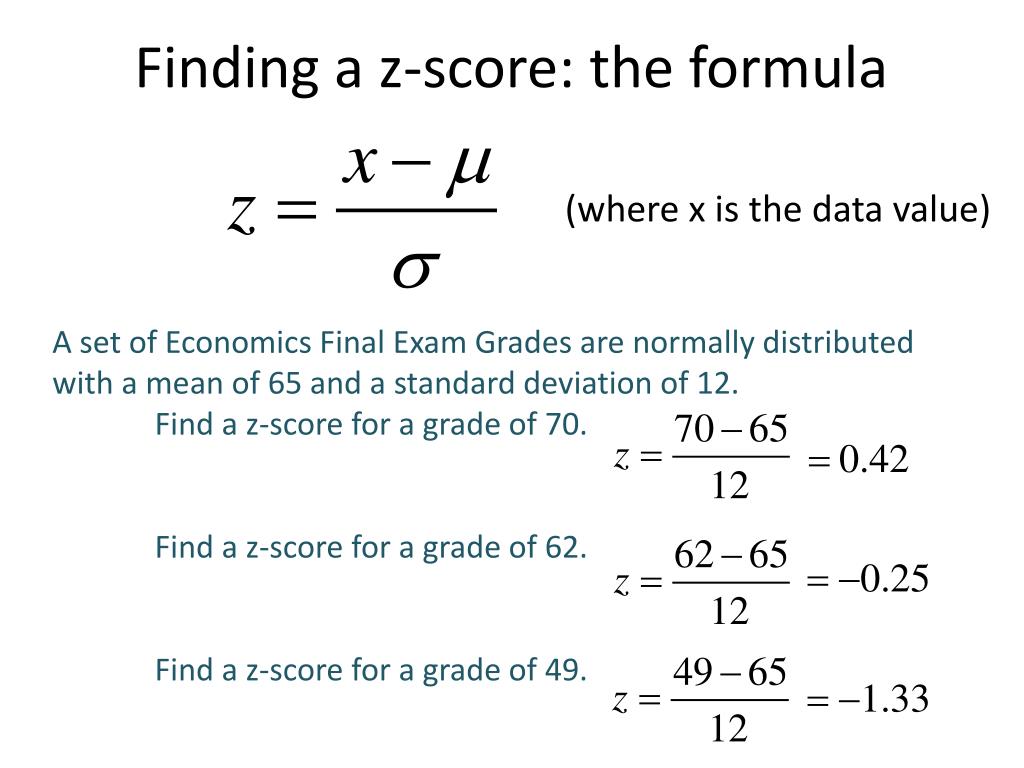
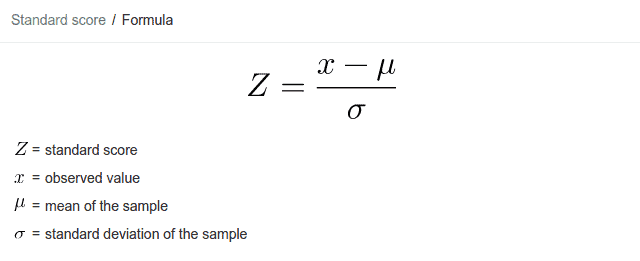
The z-value is calculated using the formula: z = (X - μ) / σ, where X is the data point, μ is the population mean, and σ is the population standard deviation. This formula provides a way to standardize the data point, allowing for comparison across different distributions.
2. Determining the Population Mean
The population mean, μ, is a critical component of the z-value calculation. It is essential to determine the correct population mean, as an incorrect value can lead to inaccurate z-scores. The population mean can be calculated using the formula: μ = (ΣX) / N, where ΣX is the sum of all data points and N is the total number of data points.
3. Calculating the Population Standard Deviation
The population standard deviation, σ, is another vital component of the z-value calculation. It can be calculated using the formula: σ = √[(Σ(X - μ)^2) / N], where Σ(X - μ)^2 is the sum of the squared differences between each data point and the population mean. The population standard deviation provides a measure of the spread of the data.
4. Identifying the Data Point
The data point, X, is the value for which the z-score is being calculated. It is essential to ensure that the data point is accurate and relevant to the analysis. The data point can be a single observation or a summary statistic, such as the mean of a sample.
5. Considering Sample Size
When working with samples, it is essential to consider the sample size, as it can affect the accuracy of the z-score. With smaller sample sizes, the z-score may not be as reliable, and alternative methods, such as the t-statistic, may be more appropriate.
6. Dealing with Unknown Population Parameters
In some cases, the population parameters, μ and σ, may be unknown. In such situations, it is necessary to use sample estimates, such as the sample mean and sample standard deviation, to calculate the z-score. However, this approach may introduce additional uncertainty and affect the accuracy of the z-score.
7. Interpreting the Z-Score
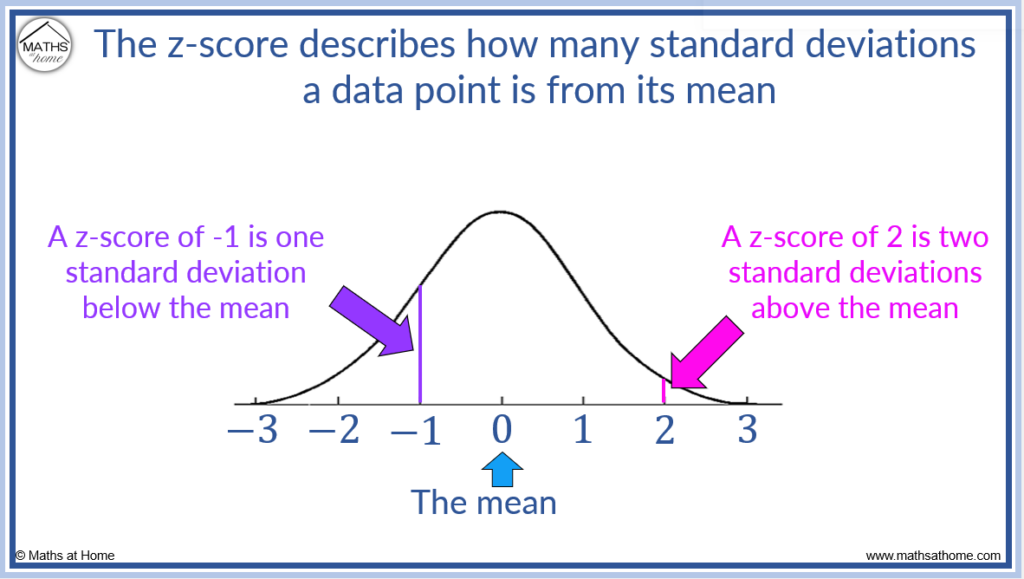
Once the z-score is calculated, it is essential to interpret the result. A z-score of 0 indicates that the data point is equal to the population mean. A positive z-score indicates that the data point is above the population mean, while a negative z-score indicates that it is below. The magnitude of the z-score provides information about the distance from the mean.
8. Using Z-Scores for Hypothesis Testing
Z-scores are commonly used in hypothesis testing to determine whether a data point is significantly different from the population mean. By comparing the calculated z-score to a critical value or using a p-value, researchers can determine whether to reject the null hypothesis and conclude that the data point is statistically significant.
9. Considering Assumptions and Limitations
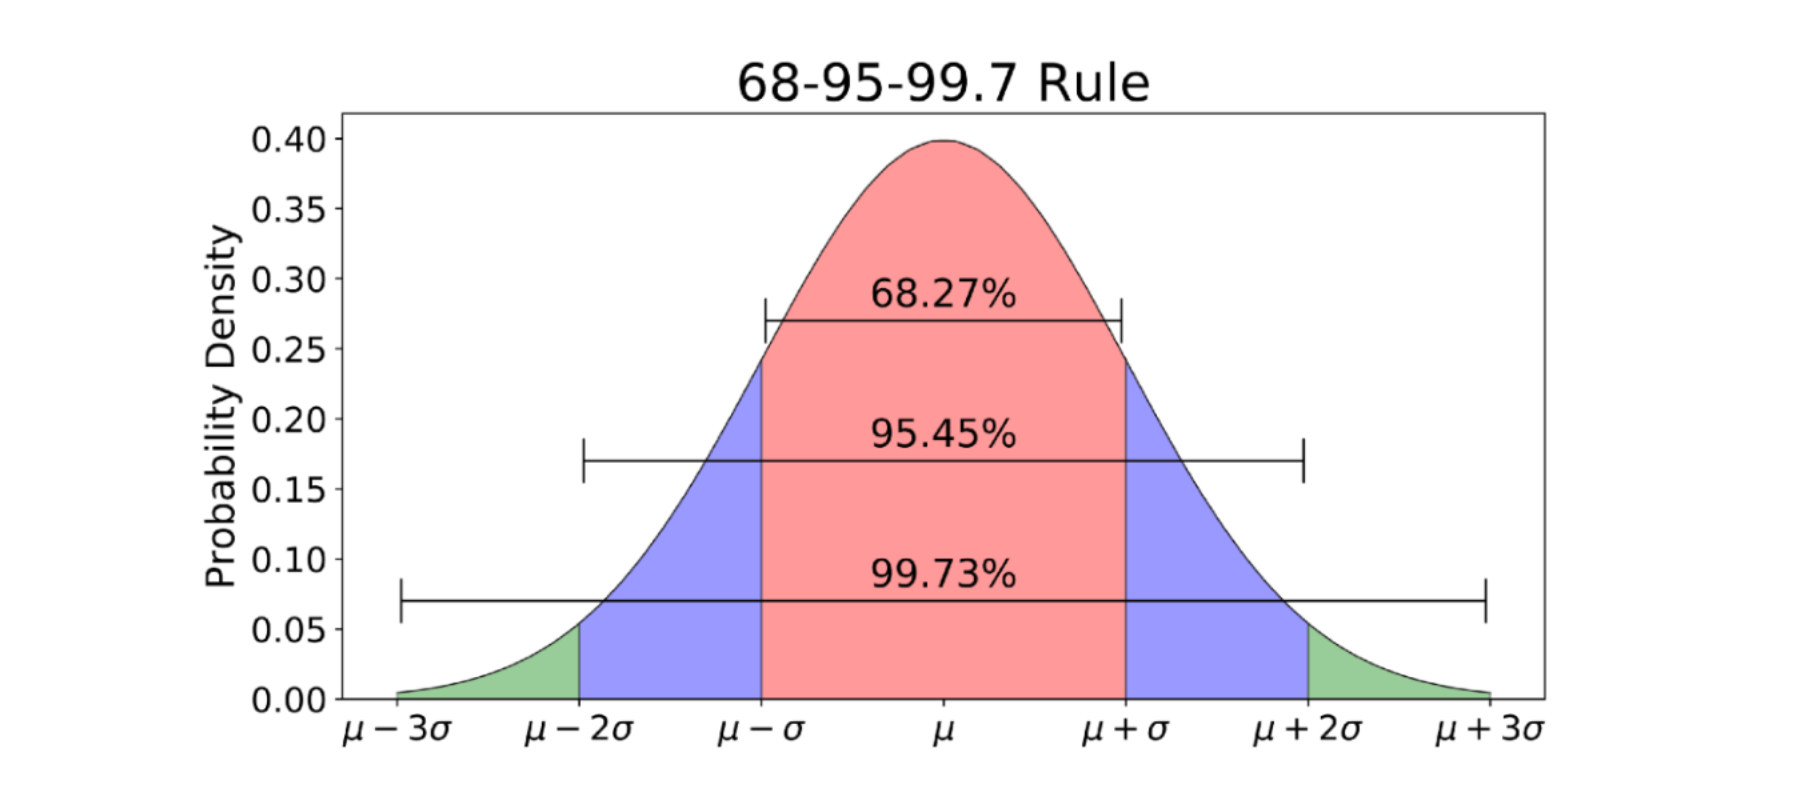
When using z-scores, it is essential to consider the assumptions and limitations of the method. The z-score assumes a normal distribution, and non-normal data may affect the accuracy of the result. Additionally, the z-score is sensitive to outliers, which can impact the calculation.
10. Using Z-Scores in Practice
In practice, z-scores have various applications, including quality control, medical research, and finance. By understanding how to calculate and interpret z-scores, professionals can make informed decisions and gain valuable insights from their data. With the increasing availability of data and computational power, z-scores remain a fundamental tool in statistical analysis.
If you are searching about How To Understand And Calculate Z-Scores – mathsathome.com you've came to the right place. We have 10 Pics about How To Understand And Calculate Z-Scores – mathsathome.com like PPT - Calculating Z-scores PowerPoint Presentation, free download - ID, P value from z score calculator - christiannibht and also Ledidi | Z-scores. Here you go:
How To Understand And Calculate Z-Scores – Mathsathome.com
 mathsathome.com
How To Understand And Calculate Z-Scores – mathsathome.com
How To Understand And Calculate Z-Scores – Mathsathome.com
 mathsathome.com
How To Understand And Calculate Z-Scores – mathsathome.com
Ledidi | Z-scores
 ledidi.com
Ledidi | Z-scores
P Value From Z Score Calculator - Christiannibht
 christiannibht.weebly.com
P value from z score calculator - christiannibht
How To Understand And Calculate Z-Scores – Mathsathome.com
 mathsathome.com
How To Understand And Calculate Z-Scores – mathsathome.com
PPT - Calculating Z-scores PowerPoint Presentation, Free Download - ID
 www.slideserve.com
PPT - Calculating Z-scores PowerPoint Presentation, free download - ID ...
How To Understand And Calculate Z-Scores – Mathsathome.com
 mathsathome.com
How To Understand And Calculate Z-Scores – mathsathome.com
How To Understand And Calculate Z-Scores – Mathsathome.com
 mathsathome.com
How To Understand And Calculate Z-Scores – mathsathome.com
The Z-score And Cut-off Values - Sajeewa Pemasinghe
 sajeewasp.com
The Z-score and cut-off values - Sajeewa Pemasinghe
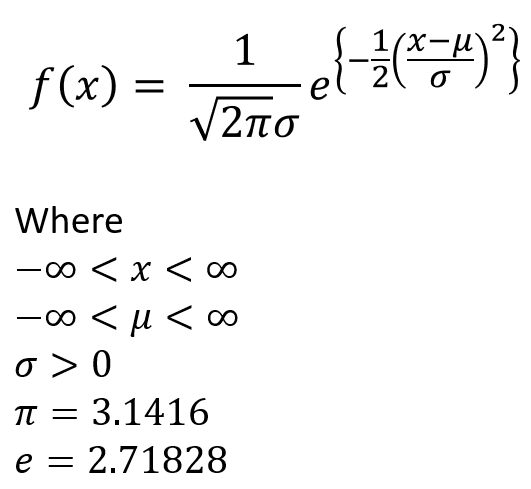
Normal Distribution | Gaussian Distribution | Bell Curve | Normal Curve
 www.ztable.net
Normal Distribution | Gaussian Distribution | Bell Curve | Normal Curve ...
How to understand and calculate z-scores – mathsathome.com. How to understand and calculate z-scores – mathsathome.com. How to understand and calculate z-scores – mathsathome.com

