When it comes to statistical analysis, one of the most commonly used tests is the paired t-test. This test is used to compare two related samples, such as measurements from the same subjects before and after a treatment. Calculating a paired t-test can seem daunting, but it's actually a straightforward process. Here are the steps to follow:
1. Define the Problem and the Null Hypothesis
The first step in calculating a paired t-test is to define the problem and the null hypothesis. The problem should be clearly stated, and the null hypothesis should be defined as a statement of no difference between the two related samples. For example, if we're comparing the weights of individuals before and after a diet, the null hypothesis might be "there is no significant difference in weight before and after the diet".
2. Gather the Data
Once the problem and null hypothesis are defined, the next step is to gather the data. This involves collecting measurements from the same subjects before and after the treatment. The data should be paired, meaning that each measurement before the treatment is matched with a corresponding measurement after the treatment.
3. Calculate the Mean Difference
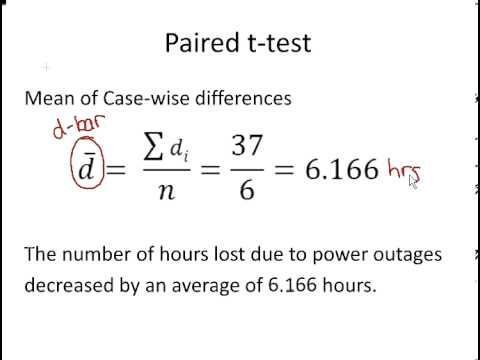
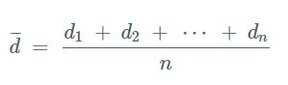
With the data gathered, the next step is to calculate the mean difference between the two related samples. This is done by subtracting the before measurement from the after measurement for each pair, and then calculating the mean of these differences.
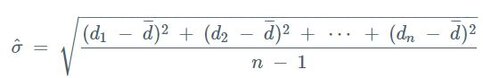
4. Calculate the Standard Deviation of the Differences
In addition to the mean difference, we also need to calculate the standard deviation of the differences. This is a measure of the amount of variation in the differences between the two related samples.
5. Calculate the Standard Error of the Mean Difference
The standard error of the mean difference is a measure of the amount of variation in the sample mean difference. This is calculated by dividing the standard deviation of the differences by the square root of the number of pairs.
6. Calculate the t-Statistic
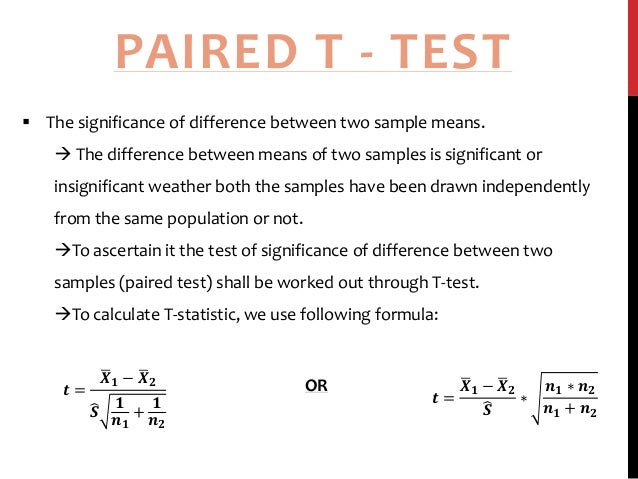
The t-statistic is a measure of the number of standard errors by which the sample mean difference differs from the known population mean difference (which is usually zero). This is calculated by dividing the mean difference by the standard error of the mean difference.
7. Determine the Degrees of Freedom
The degrees of freedom is the number of independent pieces of information used to calculate the t-statistic. For a paired t-test, the degrees of freedom is usually the number of pairs minus one.
8. Look Up the Critical t-Value or Calculate the p-Value
Once the t-statistic and degrees of freedom are calculated, the next step is to look up the critical t-value in a t-distribution table or calculate the p-value. The critical t-value is the t-value that corresponds to a certain level of significance (usually 0.05), and the p-value is the probability of obtaining a t-statistic as extreme or more extreme than the one we calculated, assuming that the null hypothesis is true.
9. Interpret the Results
The final step is to interpret the results. If the p-value is less than the chosen level of significance (usually 0.05), we reject the null hypothesis and conclude that there is a significant difference between the two related samples. If the p-value is greater than the chosen level of significance, we fail to reject the null hypothesis and conclude that there is no significant difference between the two related samples.
10. Report the Results
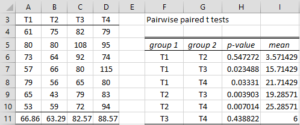
Once the results are interpreted, the final step is to report them. This involves stating the problem, the null hypothesis, the t-statistic, the degrees of freedom, the p-value, and the conclusion. The results should be reported in a clear and concise manner, and should include any relevant tables or figures to help illustrate the findings.
If you are searching about Paired T Test Formula you've visit to the right place. We have 10 Pictures about Paired T Test Formula like PAIRED T TEST ANALYSIS | PDF, Paired T Test Formula and also Julius AI | Unraveling the Paired T-Test. Here you go:
Paired T Test Formula
 fity.club
Paired T Test Formula
PAIRED T TEST ANALYSIS | PDF
 id.scribd.com
PAIRED T TEST ANALYSIS | PDF
Paired T Test Formula
 fity.club
Paired T Test Formula
Multiple Paired T-Tests | Real Statistics Using Excel
 real-statistics.com
Multiple Paired t-Tests | Real Statistics Using Excel
Paired T Distribution, Paired T Test, Paired Comparison Test, Paired
 sixsigmastudyguide.com
Paired T Distribution, Paired T Test, Paired Comparison test, Paired ...
Paired T-Test Definition, Formula, Table & Solved Examples
 testbook.com
Paired T-Test Definition, Formula, Table & Solved Examples
Paired Samples T-test: Definition, Formula, And Example
 www.statology.org
Paired Samples t-test: Definition, Formula, and Example
Paired T-Test: Definition, Formula, Table With Solved Examples
 testbook.com
Paired T-Test: Definition, Formula, Table with Solved Examples
Julius AI | Unraveling The Paired T-Test
 julius.ai
Julius AI | Unraveling the Paired T-Test
Julius AI | Unraveling The Paired T-Test
 julius.ai
Julius AI | Unraveling the Paired T-Test
Multiple paired t-tests. Multiple paired t-tests. paired t test analysis

