Calculating the odds ratio is a crucial step in understanding the relationship between two variables, particularly in medical research and epidemiology. It measures the strength and direction of association between a particular risk factor and the likelihood of developing a specific disease or condition. In this article, we will delve into the world of odds ratios, exploring what they are, how to calculate them, and what they signify. From understanding the concept of odds to interpreting the results, we will break down the process into manageable steps.
1. Understanding the Concept of Odds
Odds represent the probability of an event occurring compared to the probability of it not occurring. For instance, if the probability of developing a disease is 0.2 (or 20%), the odds are 0.2 / (1 - 0.2) = 0.25, which means that for every 1 person who develops the disease, 4 people do not. This concept is fundamental to calculating the odds ratio, as it provides the framework for comparing the odds of two different groups.
2. Defining the Odds Ratio
The odds ratio (OR) is a statistical measure that compares the odds of an event occurring in one group to the odds of the same event occurring in another group. It is calculated as the ratio of the odds of the event occurring in the exposed group to the odds of the event occurring in the non-exposed group. An OR greater than 1 indicates an increased risk, while an OR less than 1 suggests a decreased risk.
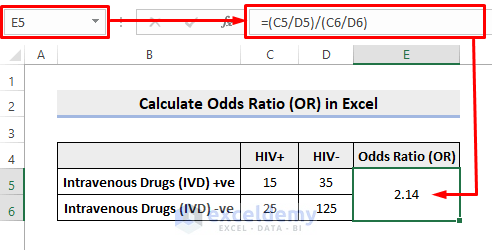
3. Calculating the Odds Ratio
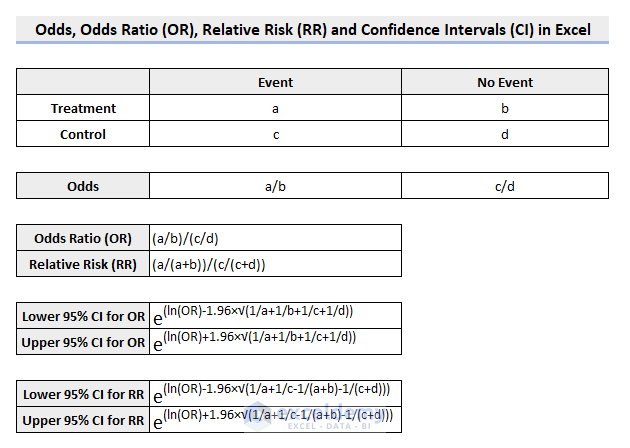
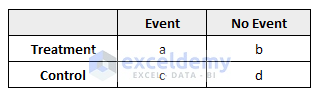
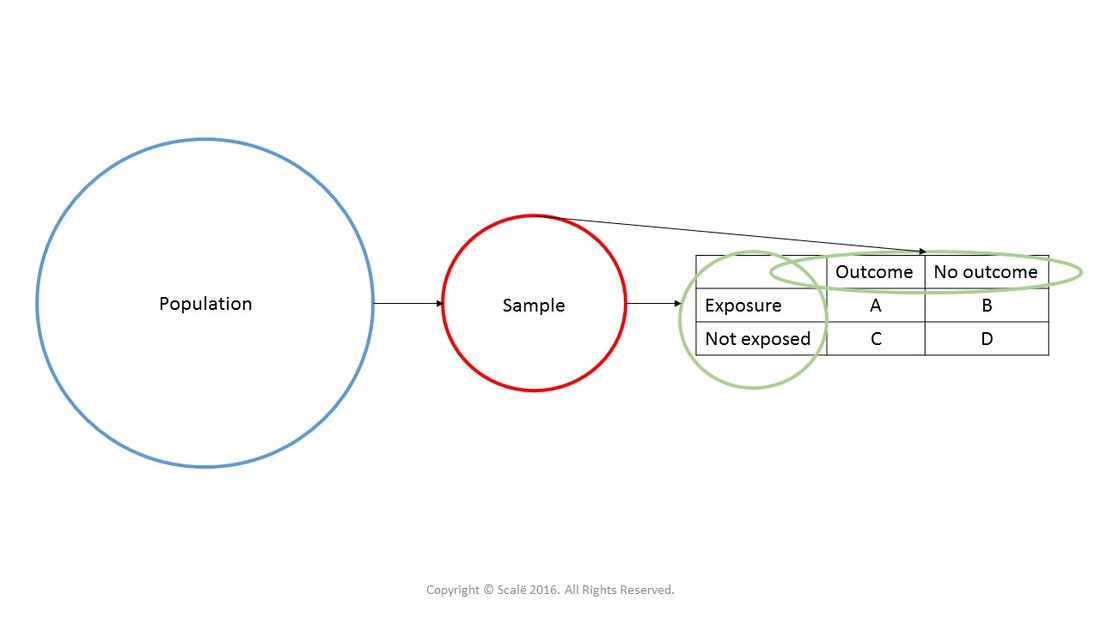
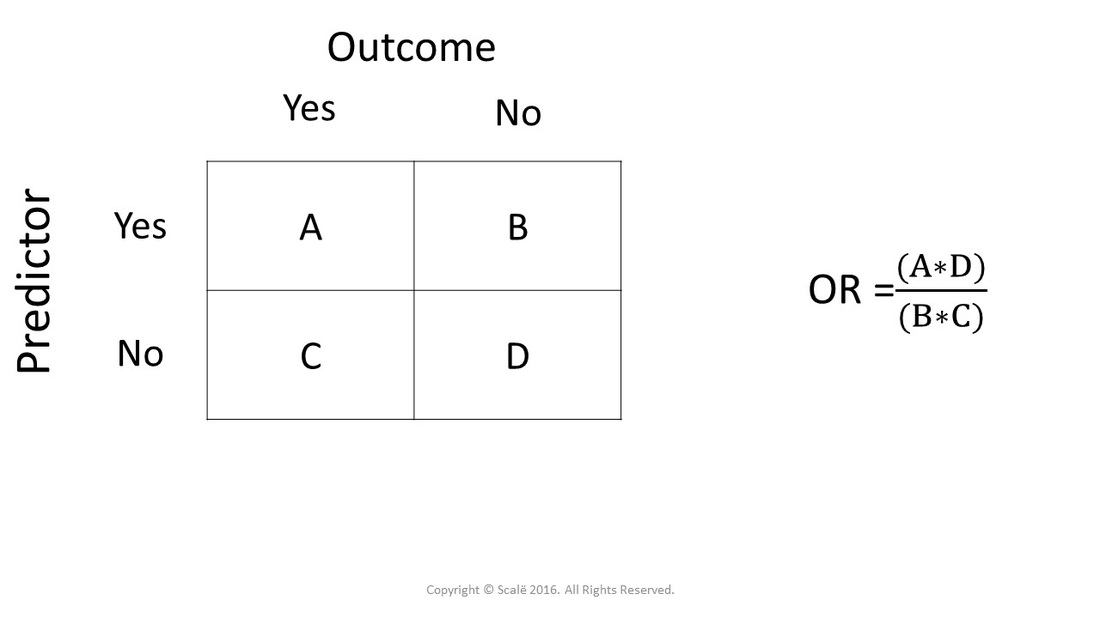
To calculate the odds ratio, we need to know the frequencies of the outcome of interest (e.g., disease) in both the exposed and non-exposed groups. Using a 2x2 contingency table, we can calculate the odds of the disease in both groups and then compute the odds ratio. The formula for the odds ratio is OR = (a/b) / (c/d), where a and c are the number of individuals with the disease in the exposed and non-exposed groups, respectively, and b and d are the number of individuals without the disease in the exposed and non-exposed groups, respectively.
4. Interpreting the Odds Ratio
Interpreting the odds ratio is crucial in understanding the strength and direction of the association between the risk factor and the disease. An odds ratio of 1 indicates no association, while an odds ratio greater than 1 indicates an increased risk. The farther the odds ratio is from 1, the stronger the association. It is essential to consider the confidence interval (CI) of the odds ratio to determine the precision of the estimate.
5. Understanding Confidence Intervals
A confidence interval provides a range of values within which the true odds ratio is likely to lie. The width of the CI depends on the sample size and the variation in the data. A narrow CI indicates a more precise estimate, while a wide CI suggests a less precise estimate. If the CI includes 1, it indicates that the association between the risk factor and the disease may be due to chance.
6. Considering the Role of Sampling Error
Sampling error can significantly impact the estimate of the odds ratio. A small sample size can lead to a wide confidence interval, making it difficult to draw firm conclusions. It is essential to consider the sample size and the potential for sampling error when interpreting the results.
7. Adjusting for Confounding Variables
Confounding variables can affect the estimate of the odds ratio, leading to biased results. It is essential to adjust for these variables using techniques such as stratification or multivariate analysis. By controlling for confounding variables, we can obtain a more accurate estimate of the odds ratio.
8. Using Odds Ratios in Practice
Odds ratios have numerous applications in medical research and epidemiology. They can be used to evaluate the effectiveness of a new treatment, identify risk factors for a disease, or assess the impact of a particular exposure on health outcomes. By understanding how to calculate and interpret odds ratios, researchers and clinicians can make more informed decisions.
9. Common Pitfalls and Limitations
There are several common pitfalls and limitations to consider when working with odds ratios. These include the potential for selection bias, information bias, and confounding variables. It is essential to be aware of these limitations and take steps to minimize their impact on the results.
10. Conclusion
In conclusion, calculating and interpreting odds ratios is a crucial step in understanding the relationship between risk factors and diseases. By following the steps outlined in this article, researchers and clinicians can gain a deeper understanding of the odds ratio and its applications in medical research and epidemiology. Remember to consider the potential limitations and pitfalls, and always interpret the results in the context of the research question and study design.
If you are searching about How to Calculate Odds Ratio in Excel - ExcelDemy you've came to the right page. We have 10 Pics about How to Calculate Odds Ratio in Excel - ExcelDemy like How to Calculate Odds Ratio (OR) in Excel - ExcelDemy, How to Calculate Odds Ratio (OR) in Excel - ExcelDemy and also Calculate Odds Ratio with 95% Confidence Intervals - Accredited. Here you go:
How To Calculate Odds Ratio In Excel - ExcelDemy
 www.exceldemy.com
How to Calculate Odds Ratio in Excel - ExcelDemy
How To Calculate Odds Ratio (OR) In Excel - ExcelDemy
 www.exceldemy.com
How to Calculate Odds Ratio (OR) in Excel - ExcelDemy
How To Calculate Odds Ratio In Excel - ExcelDemy
 www.exceldemy.com
How to Calculate Odds Ratio in Excel - ExcelDemy
How To Calculate Odds Ratio (OR) In Excel - ExcelDemy
 www.exceldemy.com
How to Calculate Odds Ratio (OR) in Excel - ExcelDemy
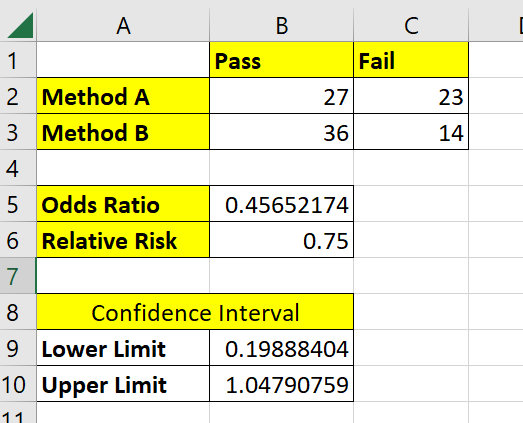
Calculate Odds Ratio With 95% Confidence Intervals - Accredited
 www.scalestatistics.com
Calculate Odds Ratio with 95% Confidence Intervals - Accredited ...
How To Calculate Odds Ratio And Relative Risk In Excel - Sheetaki
 sheetaki.com
How to Calculate Odds Ratio and Relative Risk in Excel - Sheetaki
How To Calculate Odds Ratio And Relative Risk In Excel - Sheetaki
 sheetaki.com
How to Calculate Odds Ratio and Relative Risk in Excel - Sheetaki
21+ How To Calculate The Odds Ratio Today | Hutomo
 id.hutomosungkar.com
21+ How To Calculate The Odds Ratio Today | Hutomo
How to calculate odds ratio in excel. How to calculate odds ratio and relative risk in excel. How to calculate odds ratio in excel

