Calculating the mean with standard deviation is a crucial step in understanding and analyzing data. The mean, also known as the average, provides an overview of the central tendency of a dataset, while the standard deviation measures the amount of variation or dispersion from the mean. In this article, we will explore the steps and considerations for calculating the mean with standard deviation, providing you with a comprehensive understanding of this essential statistical concept.
1. Define the Dataset and Parameters
To calculate the mean with standard deviation, first, you need to define your dataset. This involves identifying the set of numbers you want to analyze. Ensure that your dataset is free from any errors or inconsistencies that could affect the accuracy of your calculations. Additionally, determine the parameters you are interested in, such as the population or sample mean and standard deviation.
2. Calculate the Mean
The mean, or average, is calculated by summing all the numbers in your dataset and then dividing by the total count of numbers. For a population, this is represented as μ = (Σx) / N, where μ is the population mean, Σx is the sum of all the values, and N is the total number of values. For a sample, the formula is slightly different: x̄ = (Σx) / n, where x̄ is the sample mean, and n is the sample size.
3. Calculate the Deviation from the Mean
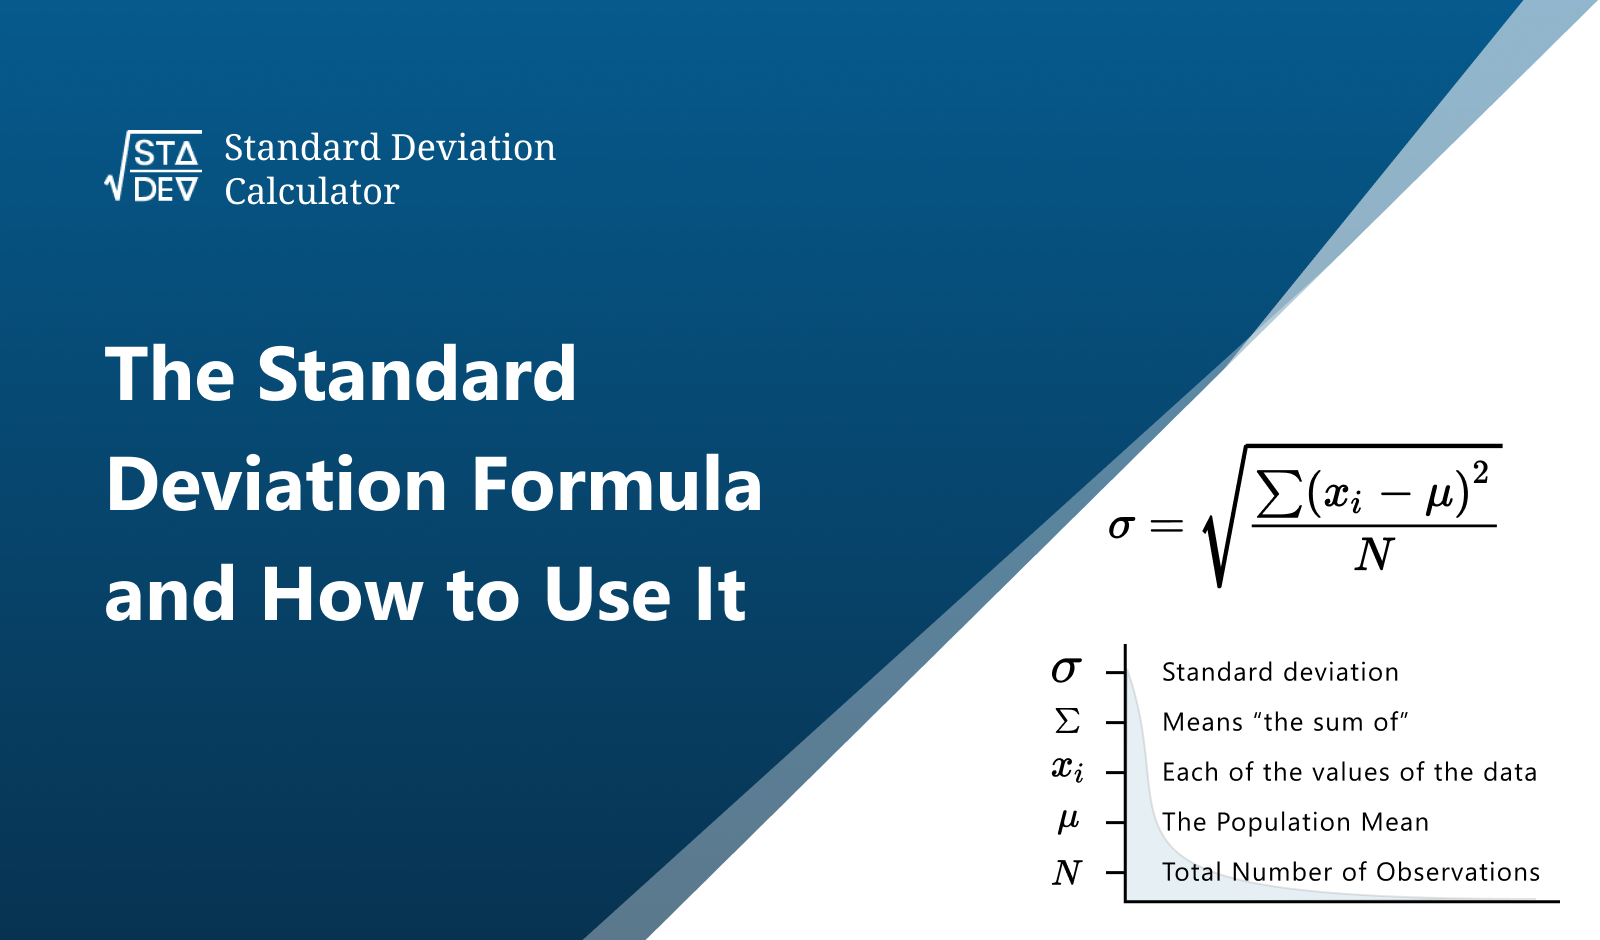
To find the standard deviation, you first need to calculate the deviation of each data point from the mean. This is done by subtracting the mean from each value, resulting in a set of deviations. These deviations can be positive or negative, depending on whether the data point is above or below the mean.
4. Square Each Deviation
Next, you square each of the deviations calculated in the previous step. This step is crucial because it eliminates the negative signs, ensuring that all values are positive and thus can be meaningfully averaged. Squaring also gives more weight to larger deviations, which is important for calculating the standard deviation.
5. Calculate the Variance
The variance is the average of the squared deviations. For a population, the variance (σ^2) is calculated by averaging the squared deviations over the total number of items (N). For a sample, the sample variance (s^2) is similarly calculated but divides by n-1 instead of n to get an unbiased estimate of the population variance.
6. Find the Standard Deviation
The standard deviation is the square root of the variance. For a population, it is represented as σ, and for a sample, it is represented as s. The standard deviation provides a measure of the amount of variation or dispersion of a set of values. A low standard deviation means that most of the numbers are close to the average, while a high standard deviation indicates that the numbers are more spread out.
7. Interpret the Results
Interpreting the mean and standard deviation together is key to understanding your dataset. The mean gives you the central tendency, while the standard deviation tells you about the variability around that central tendency. For example, if the mean is 10 with a standard deviation of 2, most values are likely between 8 and 12 (within one standard deviation of the mean).
8. Consider the Context
The context in which you are analyzing data is crucial. Different fields and scenarios may require different approaches to calculating and interpreting mean and standard deviation. For instance, in finance, standard deviations are used to assess the volatility of investments, while in medicine, they might be used to understand the variability in patient responses to a treatment.
9. Use Appropriate Tools and Software
Fortunately, calculating the mean and standard deviation can be simplified with the use of statistical software or calculators. Tools like Microsoft Excel, Python libraries (e.g., NumPy), or statistical packages in R can automate these calculations, saving time and reducing the chance of human error.
10. Review and Validate
Finally, it's essential to review your calculations for accuracy and validate your results. Double-check your dataset for any outliers or errors that could skew your results. Also, consider whether the assumptions for using the mean and standard deviation (such as data being normally distributed) are met in your dataset.
If you are looking for How to Calculate a Sample Standard Deviation you've came to the right place. We have 10 Pics about How to Calculate a Sample Standard Deviation like Mean and Standard Deviation | PDF | Standard Deviation | Mean, How to Calculate Mean, Standard Deviation, and Standard Error (with and also Standard Deviation vs. Mean: What's the Difference?. Here it is:
How To Calculate A Sample Standard Deviation
:max_bytes(150000):strip_icc()/calculate-a-sample-standard-deviation-3126345-v4-CS-01-5b76f58f46e0fb0050bb4ab2.png) www.thoughtco.com
www.thoughtco.com
How to Calculate a Sample Standard Deviation
Mean Deviation Vs Standard Deviation – WHKRQ
 madoutdoorist.com
Mean Deviation Vs Standard Deviation – WHKRQ
5 Ways To Calculate Mean, Standard Deviation, And Standard Error
 www.wikihow.com
5 Ways to Calculate Mean, Standard Deviation, and Standard Error
Standard Deviation Vs. Mean: What's The Difference?
 www.standarddeviationcalculator.io
Standard Deviation vs. Mean: What's the Difference?
5 Ways To Calculate Mean, Standard Deviation, And Standard Error
 www.wikihow.com
5 Ways to Calculate Mean, Standard Deviation, and Standard Error
How To Calculate Mean, Standard Deviation, And Standard Error (with
 www.wikihow.com
How to Calculate Mean, Standard Deviation, and Standard Error (with ...
How To Calculate Mean And Standard Deviation With Excel 2007
 www.wikihow.com
How to Calculate Mean and Standard Deviation With Excel 2007
5 Ways To Calculate Mean, Standard Deviation, And Standard Error
 www.wikihow.com
5 Ways to Calculate Mean, Standard Deviation, and Standard Error
Mean And Standard Deviation | PDF | Standard Deviation | Mean
 www.scribd.com
Mean and Standard Deviation | PDF | Standard Deviation | Mean
Example 10 - Calculate Mean, Variance, Standard Deviation
 www.teachoo.com
Example 10 - Calculate mean, variance, standard deviation
How to calculate a sample standard deviation. Mean and standard deviation. 5 ways to calculate mean, standard deviation, and standard error

