When it comes to understanding and analyzing data, one of the most effective tools at our disposal is the five-number summary. This powerful statistical method allows us to distill complex datasets down into five key figures, giving us a clear and concise picture of the data's distribution. In this article, we'll delve into how to calculate the five-number summary, exploring each step of the process in detail.
1. Understanding the Five-Number Summary
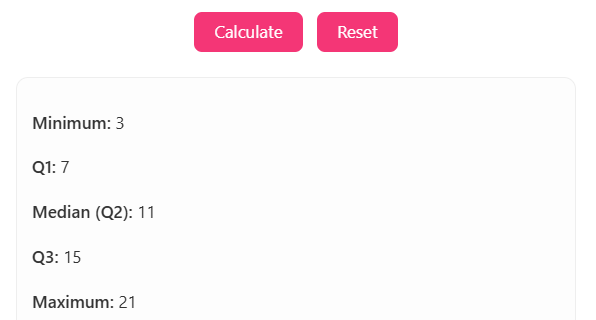
The five-number summary is a statistical tool used to summarize a dataset. It consists of five values: the minimum, first quartile (Q1), median (second quartile, Q2), third quartile (Q3), and the maximum. These numbers provide a comprehensive overview of the data's central tendency, dispersion, and shape, making it easier to understand and compare different datasets.
2. Finding the Minimum Value
The first step in calculating the five-number summary is to find the minimum value in the dataset. This is the smallest number in the dataset and represents the lowest value that the data can take. To find the minimum, simply sort the data in ascending order and identify the first value. This value is crucial as it helps in understanding the starting point of the data distribution.
3. Calculating the First Quartile (Q1)
The first quartile, or Q1, is the value below which 25% of the data points fall. It is a measure of the lower portion of the data and is found by sorting the data and then selecting the value at the 25th percentile. If the data is skewed, Q1 can give insight into the extent of the skewness and the density of the data in its lower range.
4. Determining the Median (Q2)
The median, also known as the second quartile or Q2, is the middle value in the dataset when it is sorted in ascending order. If the dataset has an even number of observations, the median is the average of the two middle numbers. The median is a measure of central tendency and is less affected by outliers compared to the mean, making it a reliable measure for skewed distributions.
5. Finding the Third Quartile (Q3)
The third quartile, or Q3, represents the value below which 75% of the data points fall. It is found in a similar manner to Q1 but at the 75th percentile. Q3 gives insight into the upper portion of the data distribution and, when compared to Q1, can help identify if the data is symmetric or if it has a long tail in one direction.
6. Identifying the Maximum Value
The maximum value is the highest number in the dataset and represents the upper limit of the data's range. Like the minimum, it's found by sorting the data, but this time, you look for the last value. The maximum value, in conjunction with the minimum, helps define the total range of the data, providing a quick glance at the data's spread.
7. Interpreting the Five-Number Summary
Once you have the five-number summary, you can begin to interpret what these figures tell you about your data. The difference between Q3 and Q1 (known as the interquartile range or IQR) can indicate the spread of the middle portion of the data. The relationship between these numbers can also hint at the presence of outliers and the overall shape of the data distribution.
8. Visualizing the Data with the Five-Number Summary
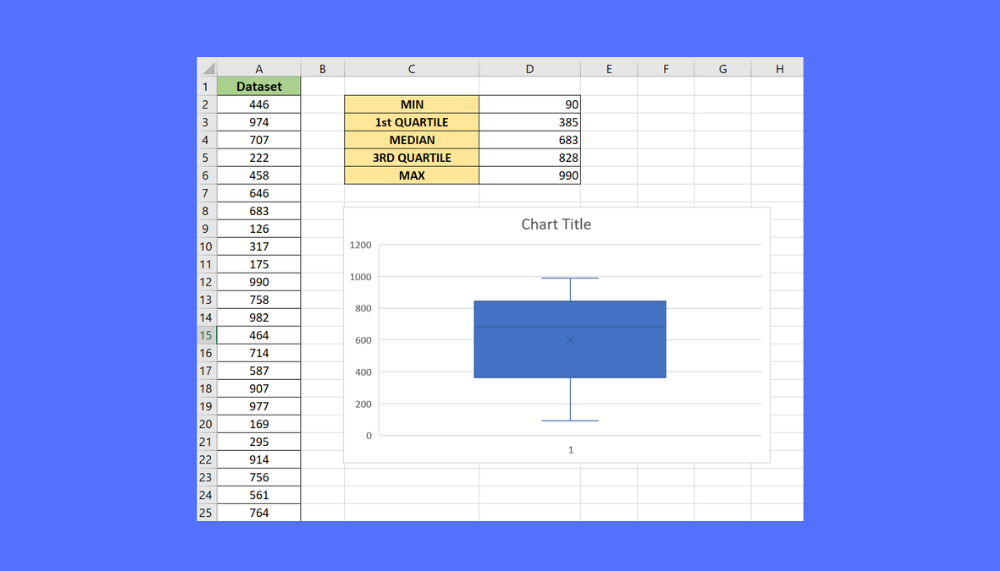
A practical way to visualize the five-number summary is through a boxplot. A boxplot displays the minimum, Q1, median, Q3, and maximum in a graphical format, allowing for quick comparisons between different datasets and providing a visual representation of the data's central tendency, dispersion, and skewness.
9. Applying the Five-Number Summary in Real-World Scenarios
The five-number summary is not just a statistical tool; it has practical applications in various fields, including economics, healthcare, and social sciences. For instance, in economics, it can be used to analyze income distributions, while in healthcare, it might be used to understand the distribution of patient outcomes. Its ability to summarize complex data makes it invaluable for decision-making and policy development.
10. Conclusion on the Five-Number Summary
In conclusion, the five-number summary is a powerful tool for data analysis that offers a comprehensive view of a dataset's characteristics. By calculating and understanding the minimum, Q1, median, Q3, and maximum, researchers and analysts can gain deep insights into their data, facilitating informed decision-making and further statistical analysis. Whether you're working in academia, business, or any field that involves data, mastering the five-number summary can significantly enhance your ability to extract meaningful information from datasets.
If you are searching about Free Five Number Summary | Interquartile Range Calculator 2025 you've visit to the right place. We have 10 Pictures about Free Five Number Summary | Interquartile Range Calculator 2025 like Five Number Summary | PDF | Statistical Analysis | Teaching Mathematics, Free Five Number Summary | Interquartile Range Calculator 2025 and also Free Five Number Summary | Interquartile Range Calculator 2025. Here you go:
Free Five Number Summary | Interquartile Range Calculator 2025
 calculategwa.com
Free Five Number Summary | Interquartile Range Calculator 2025
How To Calculate A Five-Number Summary In Excel - Sheetaki
 sheetaki.com
How to Calculate a Five-Number Summary in Excel - Sheetaki
How To Calculate A Five-Number Summary In Excel - Sheetaki
 sheetaki.com
How to Calculate a Five-Number Summary in Excel - Sheetaki
Free Five Number Summary | Interquartile Range Calculator 2025
 calculategwa.com
Free Five Number Summary | Interquartile Range Calculator 2025
Five Number Summary | PDF | Statistical Analysis | Teaching Mathematics
 www.scribd.com
Five Number Summary | PDF | Statistical Analysis | Teaching Mathematics
How To Calculate A Five Number Summary In SPSS
 www.statology.org
How to Calculate a Five Number Summary in SPSS
How To Calculate A Five Number Summary In Excel
 www.statology.org
How to Calculate a Five Number Summary in Excel
How To Calculate A Five Number Summary In Excel
 www.statology.org
How to Calculate a Five Number Summary in Excel
How To Calculate A Five-Number Summary In Excel - Sheetaki
 sheetaki.com
How to Calculate a Five-Number Summary in Excel - Sheetaki
How To Calculate A Five-Number Summary In Excel - Sheetaki
 sheetaki.com
How to Calculate a Five-Number Summary in Excel - Sheetaki
How to calculate a five number summary in spss. How to calculate a five number summary in excel. five number summary

